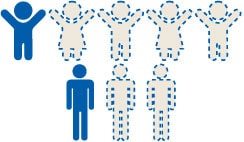
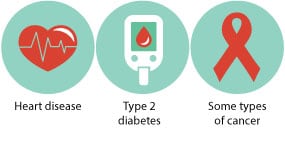
Our project aims to analyze the relationship between obesity/overweight and different risk factors such as BMI, Race, Gender, physical activities, mental health, education level, and etc. Obesity constitutes a major public health concern in the U.S. and Globally. About 1 in 5 children and more than 1 in 3 adults struggle with obesity in the U.S. (CDC) Adults with obesity have higher risk for developing Heart disease, Type 2 diabetes, and some types of cancer (CDC) According to the The “World Health Organization” (WHO), 30% of global death will be caused by lifestyle diseases by 2030. From our research, there is a limited number of studies using machine learning to analyze obesity/overweight related datasets in the U.S. Hence, we have chosen to research on different risk factors related to obesity/overweight using data from the U.S.
- Which variables are risk factors related to obesity/overweight?
- What are the correlations between different risk factors and BMI?
- Is mental health an important factor that correlates with obesity/overweight?
- Is mental health an important factor that correlates with obesity/overweight?
- Which machine learning model can classify and conduct regression of the dataset?
- Conduct EDA to find the relationship of different factors and produce visualizations.
- Find the most accurate model for our dataset.
- Classification and Regression models (e.g Random Forest, Support Vector Machines (SVM), Logistic Regression, and Decision Trees)
- The Technology and Health Departments of the University of Agder (Norway) identified potential risk factors associated with obesity/overweight using machine learning methods such as Support Vector Machines (SVM), Decision Trees, and Logistic regression models. (Chatterjee et al, 2021)
- The University of Bologna (Italy) used ML techniques to test for the predictive effects of emotional and affective variables over BMI values. (Delnevo et al, 2021)
- The Daffodil International University in Dhaka (Bangladesh) applied 9 prominent ML algorithms to predict the risk of obesity on the data collected from many varieties of people of different ages suffering from obesity and non-obesity. (Ferdowsy F. et al, 2021)
- Source:
CDC - National Center for Health Statistics. National Health and Nutrition Examination Survey March 2017 to 2020 Pre-pandemic
NHANES is a program of studies designed to assess the health and nutritional status of adults and children in the United States. The survey is unique in that it combines interviews and physical examinations. - Data type (numerical & categorical):
Demographics data, examination data, laboratory data, & questionnaire data including; Respondent sequence number, Gender, Race, Country of birth, Education level, Ratio of family income to poverty, Body measures(Weight, Height, BMI, BMI category), Diabetes status, Physical activity(Moderate work activity, recreational activity), Mental health(Depressed, Poor appetite or overeating), and Sleep disorders(Sleep hours on weekdays and weekends). - Dataset size:
12.4MB - XPT. files / Zipped data file:1.4 MB
- Heatmap of risk factors with numerical values. Besides weight and height, we found that Age also has a strong correlation to BMI.

- We found that our dataset contains infants, children, teenagers, adults, and seniors. Thus, we added a new column and separated respondents to different age groups.
Age groups: 0-3, 3-12, 13-19, 20-60, 60+

The overall female BMI is slightly higher than male BMI in our dataset.

We noticed that None-Hispanic Asians have lower BMI.

People with college degree or above tend to have lower BMI.

Respondents with depression related experiences tend to have higher BMI compared to others.


