Siyu Ma
Sandra Pinto
Shruthi Boban
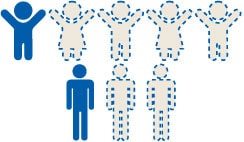
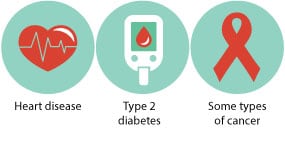
Our project aims to analyze the relationship between obesity and different risk factors such as BMI, Race, Gender, physical activities, mental health, education level, and etc. Obesity constitutes a major public health concern in the U.S. and Globally. About 1 in 5 children and more than 1 in 3 adults struggle with obesity in the U.S. (CDC) Adults with obesity have higher risk for developing Heart disease, Type 2 diabetes, and some types of cancer (CDC) According to the World Health Organization(WHO), 30% of global death will be caused by lifestyle diseases by 2030. From our research, there is a limited number of studies using machine learning to analyze obesity related datasets in the U.S. Hence, we have chosen to research on different risk factors related to obesity using data from the U.S.
- Which variables are risk factors related to obesity?
- What are the correlations between different risk factors and BMI?
- Is mental health an important factor that correlates with obesity?
- Is mental health an important factor that correlates with obesity?
- Which machine learning model can accurately classify the dataset?
- Conduct EDA to find the relationship of different factors and produce visualizations.
- Find the most accurate model for our dataset.
- Classification models (e.g Random Forest, Support Vector Machines (SVM), Logistic Regression, and Decision Trees)
- The Technology and Health Departments of the University of Agder (Norway) identified potential risk factors associated with obesity using machine learning methods such as Support Vector Machines (SVM), Decision Trees, and Logistic regression models. (Chatterjee et al, 2021)
- The Daffodil International University in Dhaka (Bangladesh) applied 9 prominent ML algorithms to predict the risk of obesity on the data collected from many varieties of people of different ages suffering from obesity and non-obesity. (Ferdowsy F. et al, 2021)
- The University of Bologna (Italy) used ML techniques to test for the predictive effects of emotional and affective variables over BMI values. (Delnevo et al, 2021)
Approach: Both classification and Regression models including K-Nearest neighbor, Classification and Regression Tree, support Vector Machine, Multi-Layer Perceptron, Ada boosting with decision tree, Gradient Boosting, Random Forest, LASSO (Least Absolute Shrinkage and Selection Operator), and Elastic Regression.
Findings: Using affect-related variables it is possible to predict the BMI with a good level of accuracy and the psychological variable that had most impact on the predictive capabilities of the algorithms is Depression The best performance was achieved by the LASSO and Elastic Net, with a MAE (mean absolute error) equal to 4.35 and the PCCs (Pearson correlation coefficient ) respectively of 0.81 and 0.80, indicating a strong correlation between predictions and real value.
Limitations:Restricted number of subjects
It did not employ newly collected data, thus making inferences limited
Lack of other factors such as lifestyle habits
- Source:
CDC - National Center for Health Statistics. National Health and Nutrition Examination Survey March 2017 to 2020 Pre-pandemic
NHANES is a program of studies designed to assess the health and nutritional status of adults and children in the United States. The survey is unique in that it combines interviews and physical examinations. - Data type (numerical & categorical):
Demographics data, examination data, laboratory data, & questionnaire data including; Respondent sequence number, Gender, Race, Country of birth, Education level, Ratio of family income to poverty, Body measures(Weight, Height, BMI, BMI category), Diabetes status, Physical activity(Moderate work activity, recreational activity), Mental health(Depressed, Poor appetite or overeating), and Sleep disorders(Sleep hours on weekdays and weekends). - Dataset size:
12.4MB - XPT. files / Zipped data file:1.4 MB
-
Added a column for showing Obesity/overweight Level for each respondent.
-
Filtered out Weight and BMI from the dataset: Weight and BMI are highly correlated with obesity/overweight.
-
Normalizing data using mean-max transformation which scaling each variable to the range (0, 1).
-
Split data to Training and Testing set.
-
For our modeling section, we used Random Forest, Logistic Regression Model and SVM to predict accuracy and feature importance of risk factors.
-
We decided to create a baseline classification model as a benchmark.
- A simple model that provides reasonable results on a task or a metric you would hope any model could beat.
- Provide the required point of comparison when evaluating all other machine learning algorithms on your problem.
- A benchmark is vital in evaluating whether a complex model is performing well, and enables us to address the accuracy/complexity tradeoff.
After that, we implemented
- Logistic Regression Model
- SVM Model
- Decision Tree Model
- Random Forest Model
- XGBoost Model
Results showed that XGBoost Model have the best accuracy compared to other models.

- Precision shows how much was correctly classified as positive out of all the positives. Recall of a classifier is the ratio between how much was correctly identified as positive to all the actual positives. Moreover, F1-score means the weighted average between precision and recall. Based on our research, F1-score is beneficial for imbalanced datasets.
- We also checked the precision-recall curve, and calculated the AUC score for each model:

- The results of model evaluation showed that the XGBoost model has the best performance in this project.
- The top 6 risk factors are Height, Age, Race, Family income ratio, Sleep hours on weekdays, and Sleep hours on weekends.
- In our literature review, we learned that depression can affect obesity levels. However, based on our analysis we can not say that mental health is highly affecting obesity level.
Due to the limited access to robust open-source healthcare datasets based on the US laws such as HIPAA (protects sensitive patient health information); The dataset does not include some features that we were interested in, such as eating habits, family history of obesity, or other diseases. Better models can be built with more data for the 20-60 age groups, and higher accuracy is expected. Although the accuracy levels from our models were considerably low, we do have a significant improvement compared to the baseline model.
Apply Neural Network with Backpropagation in order to self learn and improve the accuracy while feeding in new data. Find a better dataset to do in depth research and build prediction models for other relevant disease Build a web interface/tool for disease prediction such as Diabetes.
- https://wwwn.cdc.gov/nchs/nhanes/search/datapage.aspx?Component=Demographics&Cycle=2017-2020
- https://wwwn.cdc.gov/nchs/nhanes/search/datapage.aspx?Component=Examination&Cycle=2017-2020
- https://wwwn.cdc.gov/nchs/nhanes/search/datapage.aspx?Component=Questionnaire&Cycle=2017-2020
- Chatterjee A, Gerdes MW, Martinez SG. Identification of Risk Factors Associated with Obesity and Overweight—A Machine Learning Overview. Sensors. 2020; 20(9):2734. https://doi.org/10.3390/s20092734
- Wilfley, D. E., Hayes, J. F., Balantekin, K. N., Van Buren, D. J., & Epstein, L. H. (2018). Behavioral interventions for obesity in children and adults: Evidence base, novel approaches, and translation into practice. American Psychologist, 73(8), 981–993. https://doi-org.proxy-bc.researchport.umd.edu/10.1037/amp0000293
- CDC. (2021, March 1). Why It Matters. Centers for Disease Control and Prevention. https://www.cdc.gov/obesity/about-obesity/why-it-matters.html Centers for Disease Control and Prevention. (2021, August 27). About adult BMI. Centers for Disease Control and Prevention.
- Retrieved September 29, 2021, from https://www.cdc.gov/healthyweight/assessing/bmi/adult_bmi/index.html.
- Ferdowsy, F.,Rahi, K. S. A., Jabiullah, Md. I., Habib, Md. T. (2021, August 5). A Machine Learning approach for obesity risk prediction. Current Research in Behavioral Science, 2, 2021. https://doi.org/10.1016/j.crbeha.2021.100053
- Delnevo, G., Mancini, G., Roccetti, M., Salomoni, P., Trombini, E., & Andrei, F. (2021). The Prediction of Body Mass Index from Negative Affectivity through Machine Learning: A Confirmatory Study. Sensors, 21(7). https://doi.org/10.3390/s21072361
- Pillai , R., Saravanan, S., & Shyam, D. G. K. (2020, December 8). The BMI and mental Illness NEXUS: A machine learning approach. IEEE Xplore. Retrieved September 29, 2021, from https://ieeexplore.ieee.org/stamp/stamp.jsp?tp=&arnumber=9277446.


