| usage | running the notebooks | issues | license|
Dashboard example for inverting 1D DC resistivity data
This example runs a DC resistivity forward simulation for a 1D layered earth model that can have up to 5 layers.
You can also run the example as a voila dashboard using the below link
Dependencies are specified in requirements.txt
pip install -r requirements.txt
To run the notebooks locally, you will need to have python installed, preferably through anaconda .
You can then clone this repository. From a command line, run
git clone https://github.com/simpeg-research/gwb-dc-dashboard.git
Then cd into the gwb-dc-dashboard directory:
cd heagy-2018-AEM
To setup your software environment, we recommend you use the provided conda environment
conda env create -f environment.yml
conda activate gwb-dc
alternatively, you can install dependencies through pypi
pip install -r requirements.txt
You can then launch Jupyter
jupyter notebook
Jupyter will then launch in your web-browser.
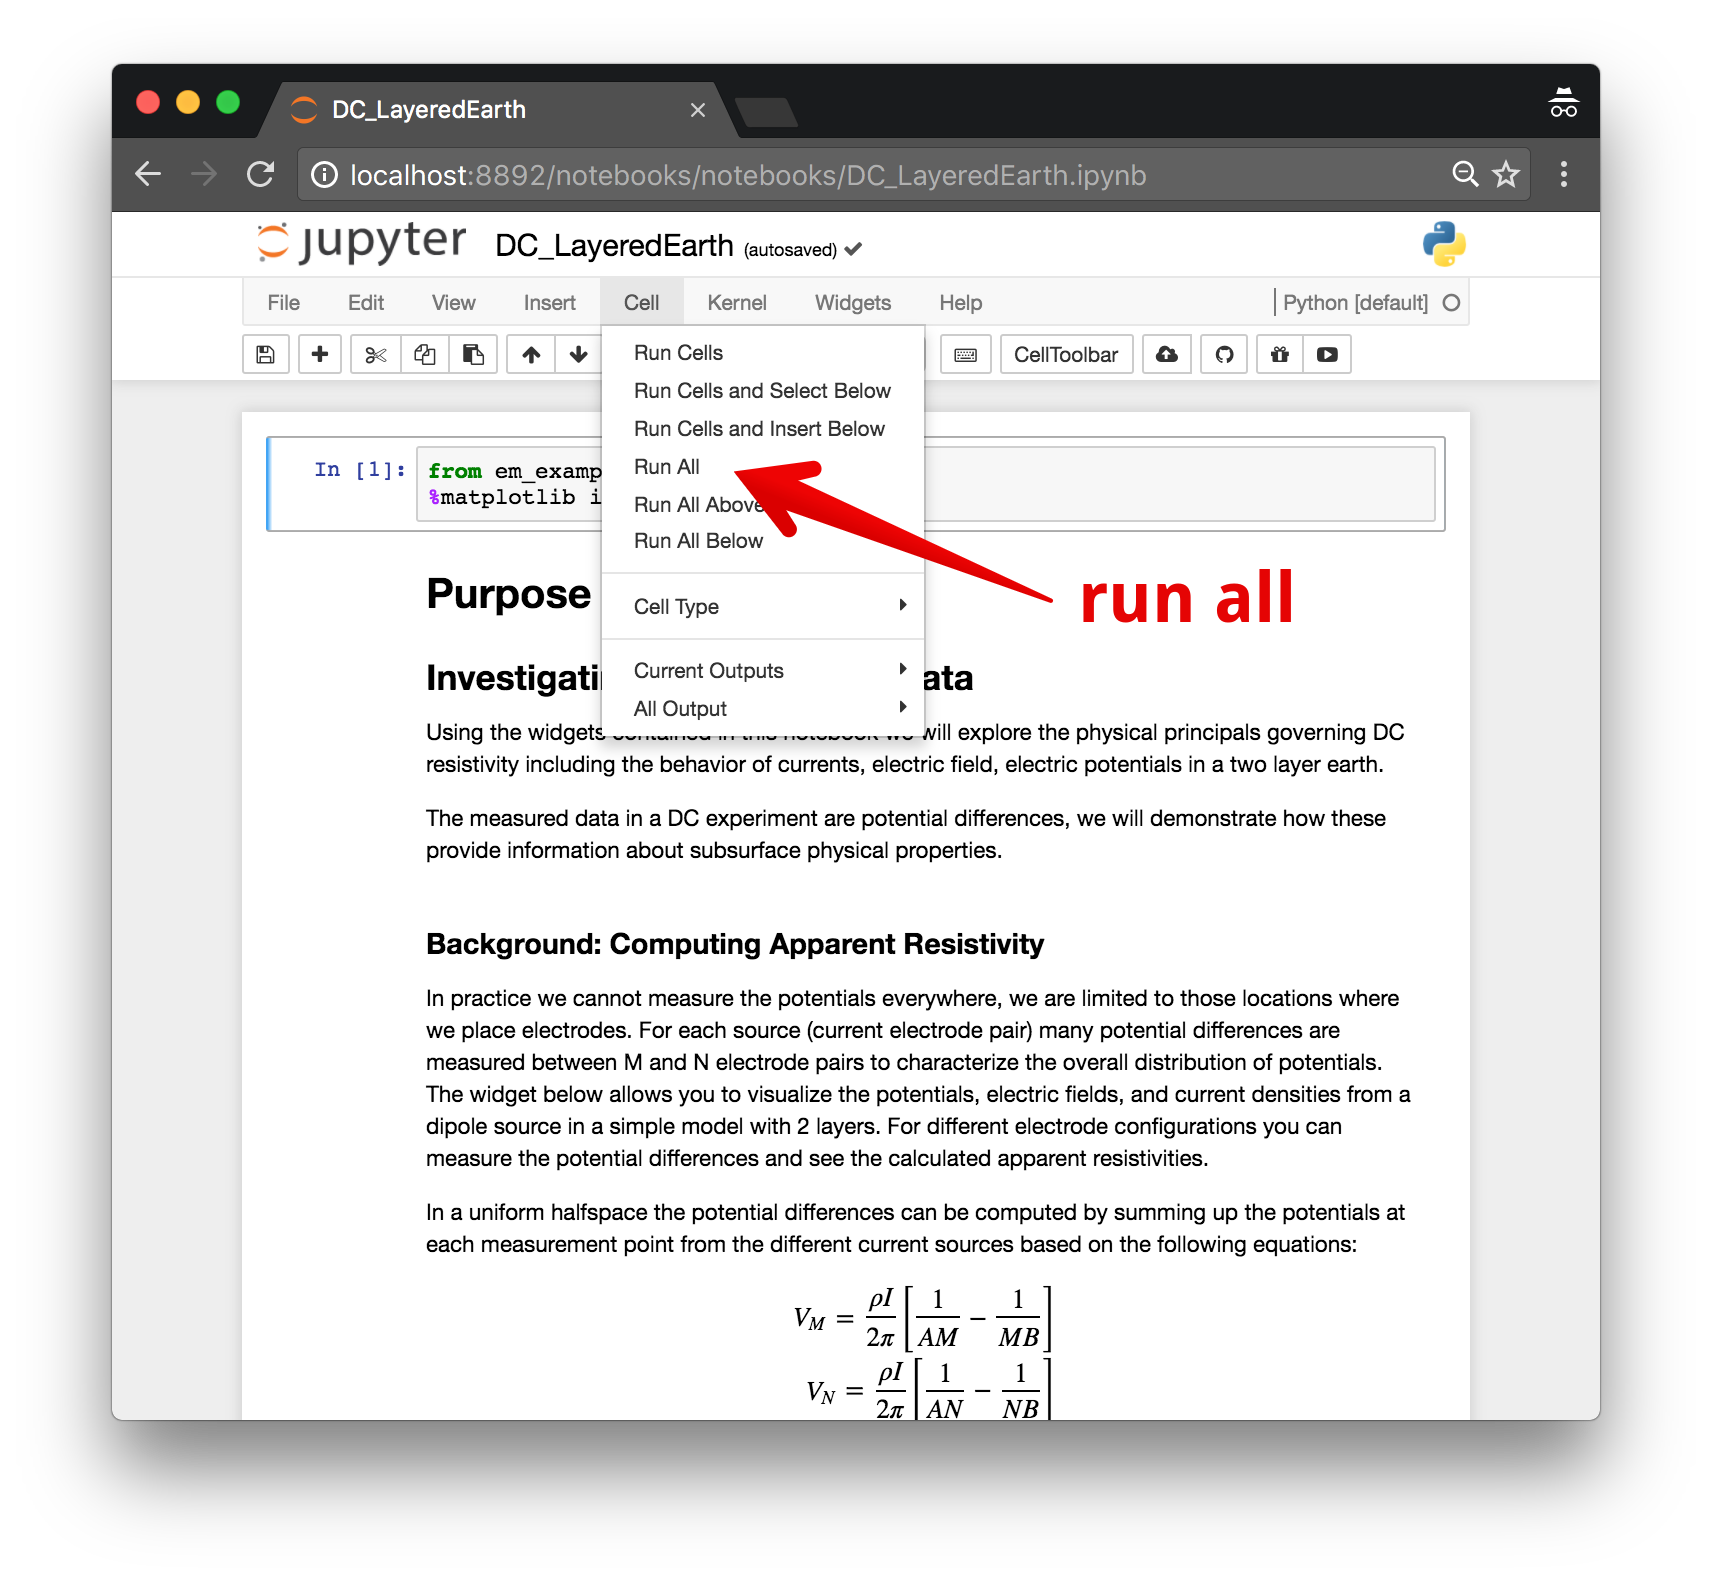
Each cell of code can be run with shift + enter or you can run the entire notebook by selecting cell, Run All in the toolbar.
For more information on running Jupyter notebooks, see the Jupyter Documentation
Please make an issue if you encounter any problems while trying to run the notebooks.
These notebooks are licensed under the BSD3 License which allows academic and commercial re-use and adaptation of this work.


