-
-
Notifications
You must be signed in to change notification settings - Fork 46
User Documentation
EMBArk is started by running
EMBArk lets you set the environment variable TIME_ZONE
to one of the pytz timezone options
sudo ./run-server.sh [-a <ALIAS/IP>] [-b <ADMIN-IPs>] [-h]
which will
- start the 2 backend-container
- setup the server environment
- start 2/4 web-interfaces
- enable a background service for docker-stuff
EMBArk lets you set the environment variable TIME_ZONE
to one of the pytz timezone options
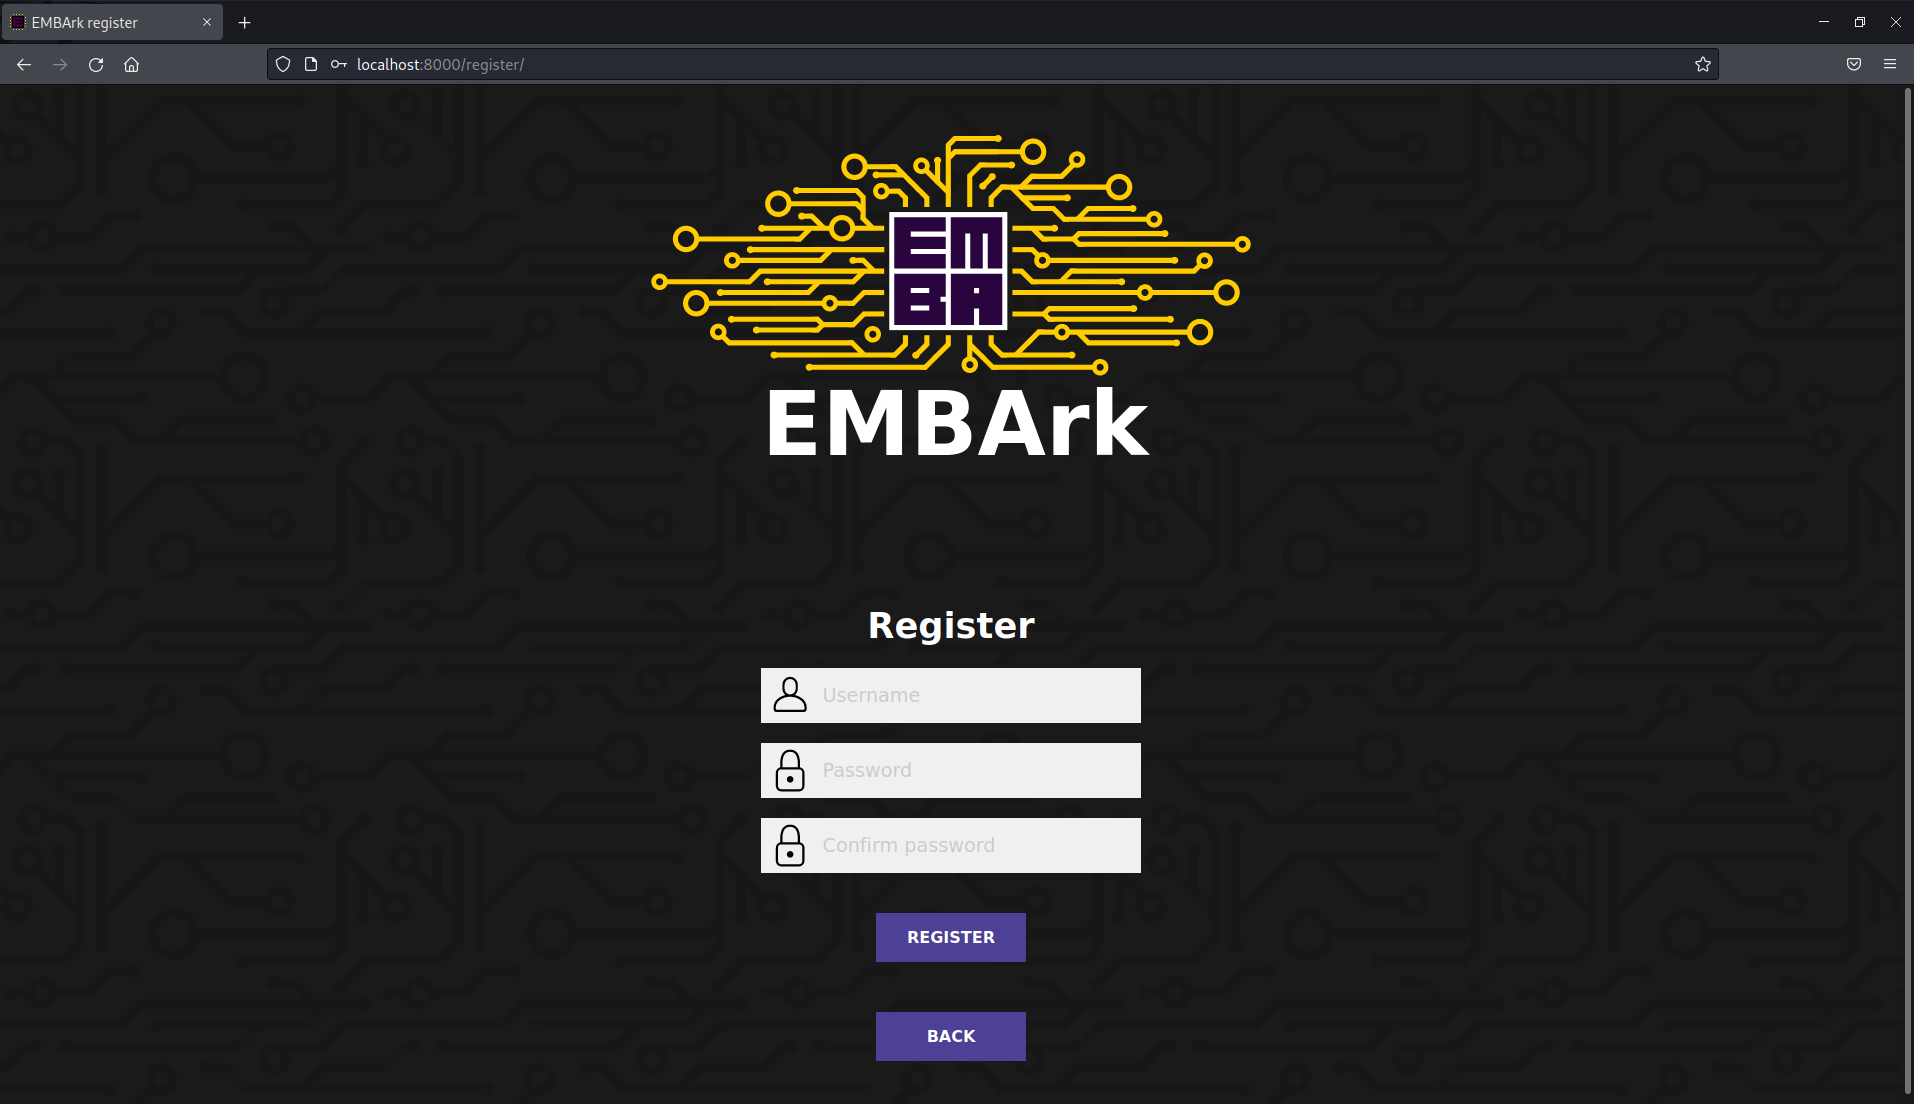
First Before accessing EMBArk you need to register yourself with username and password:
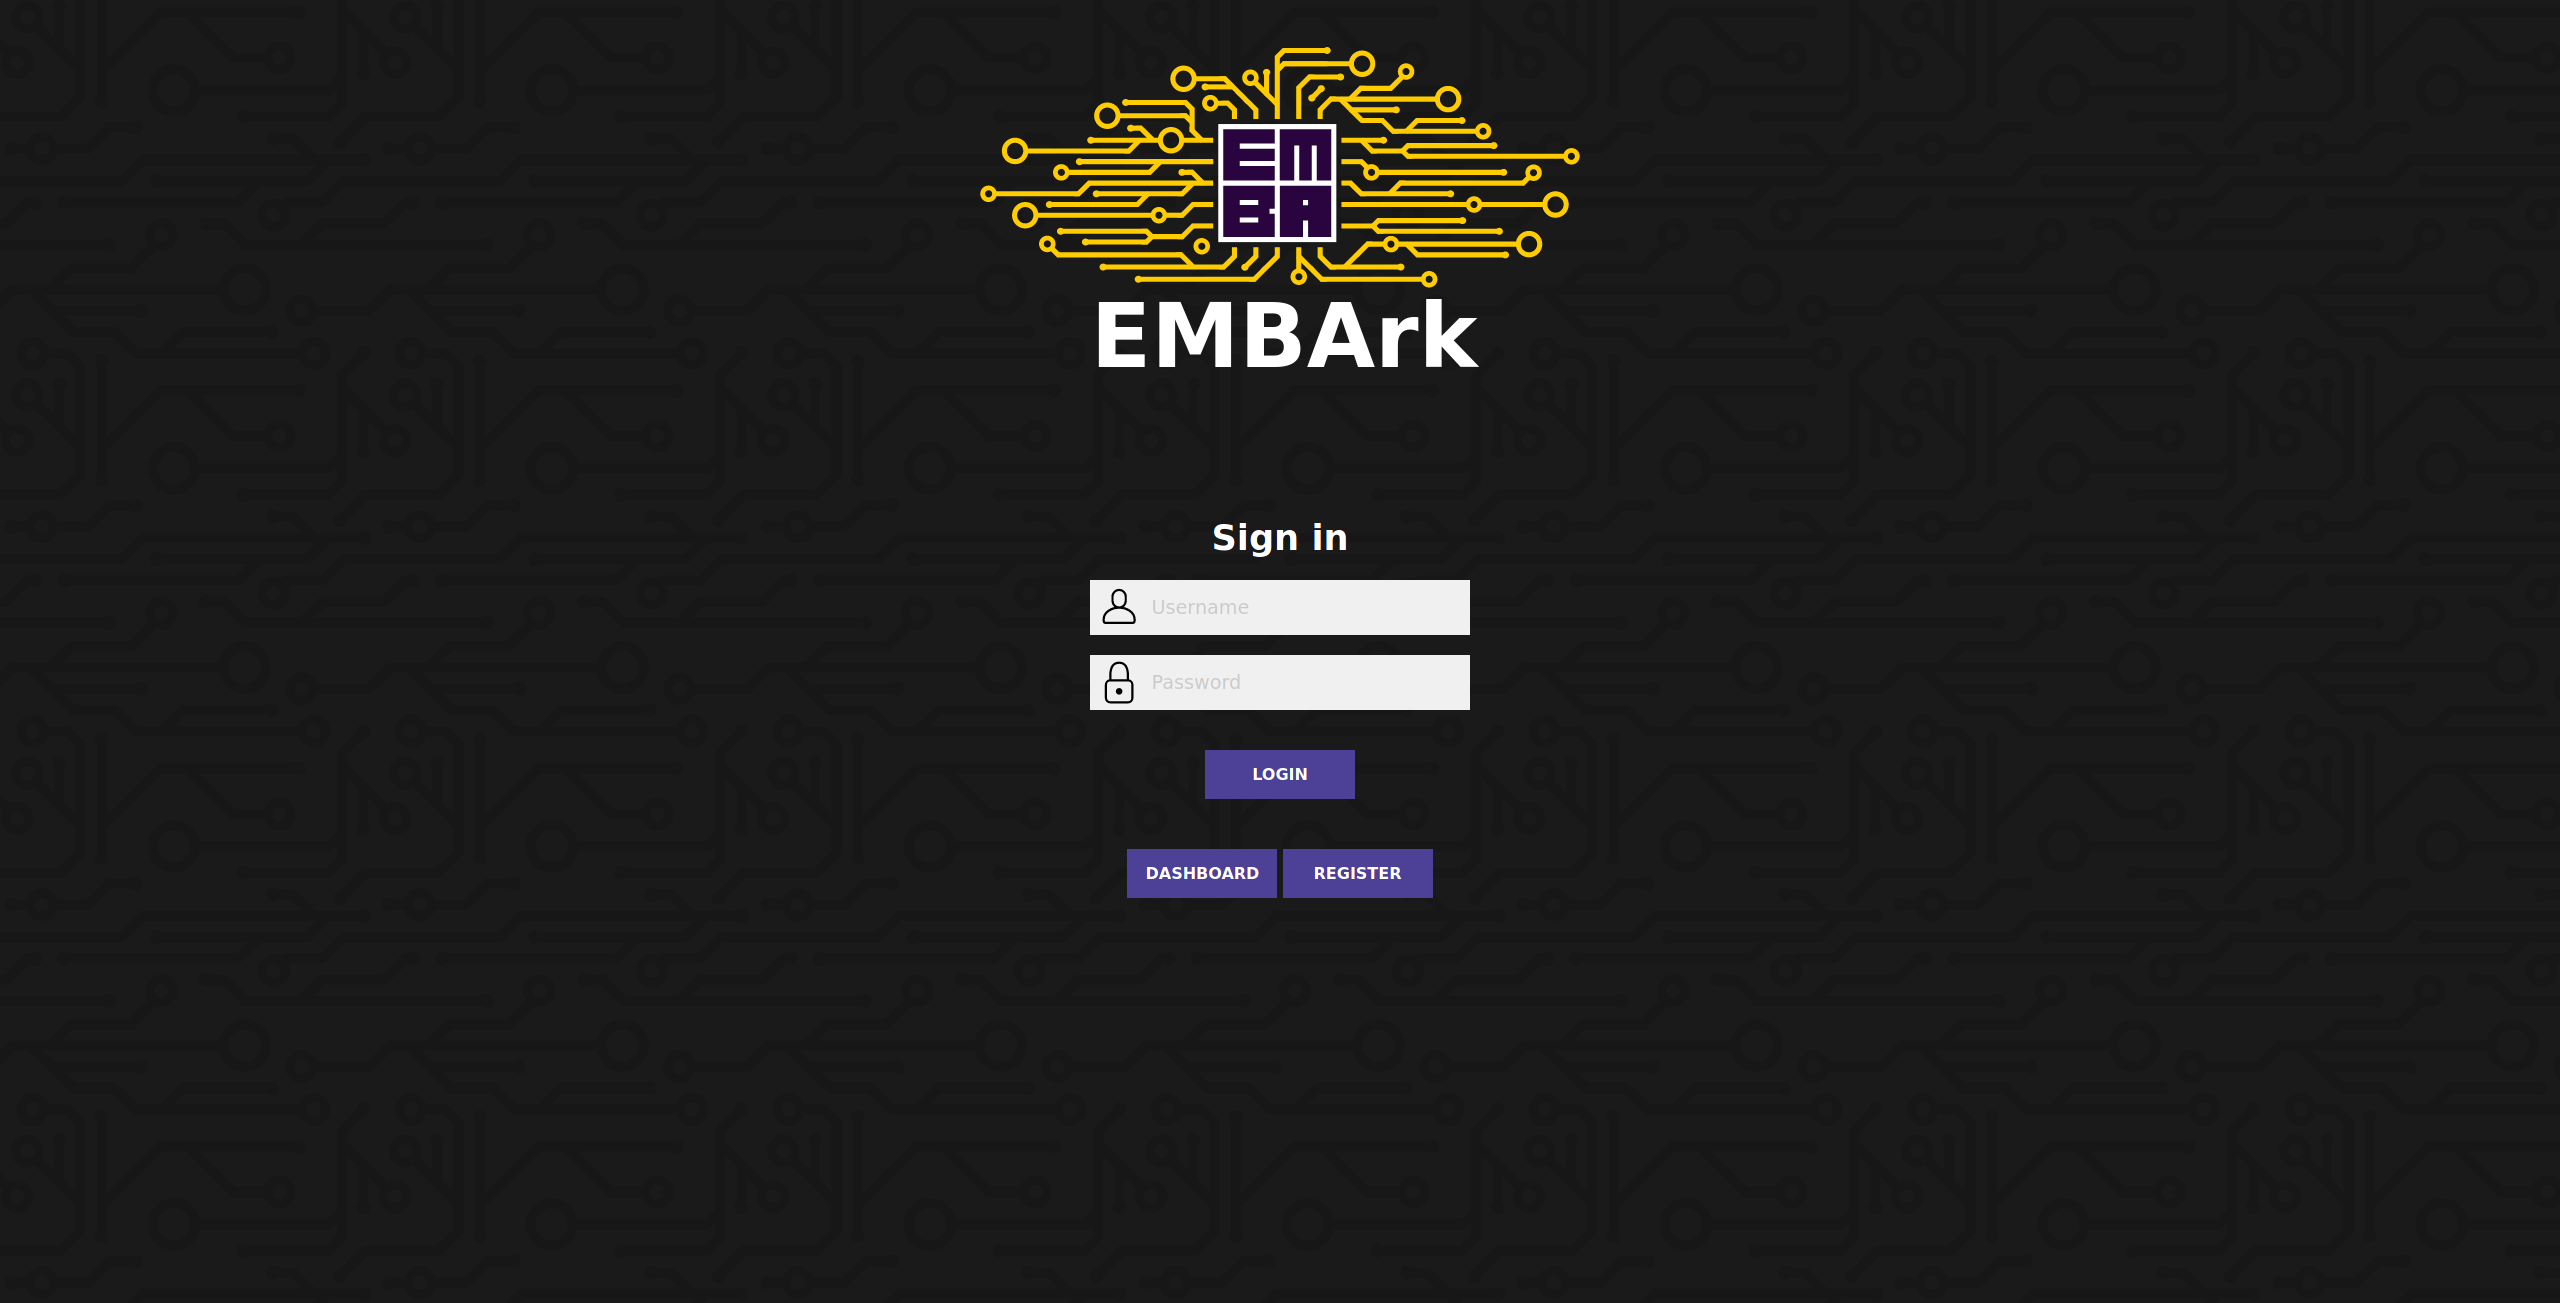
Second Now you may login and start your research
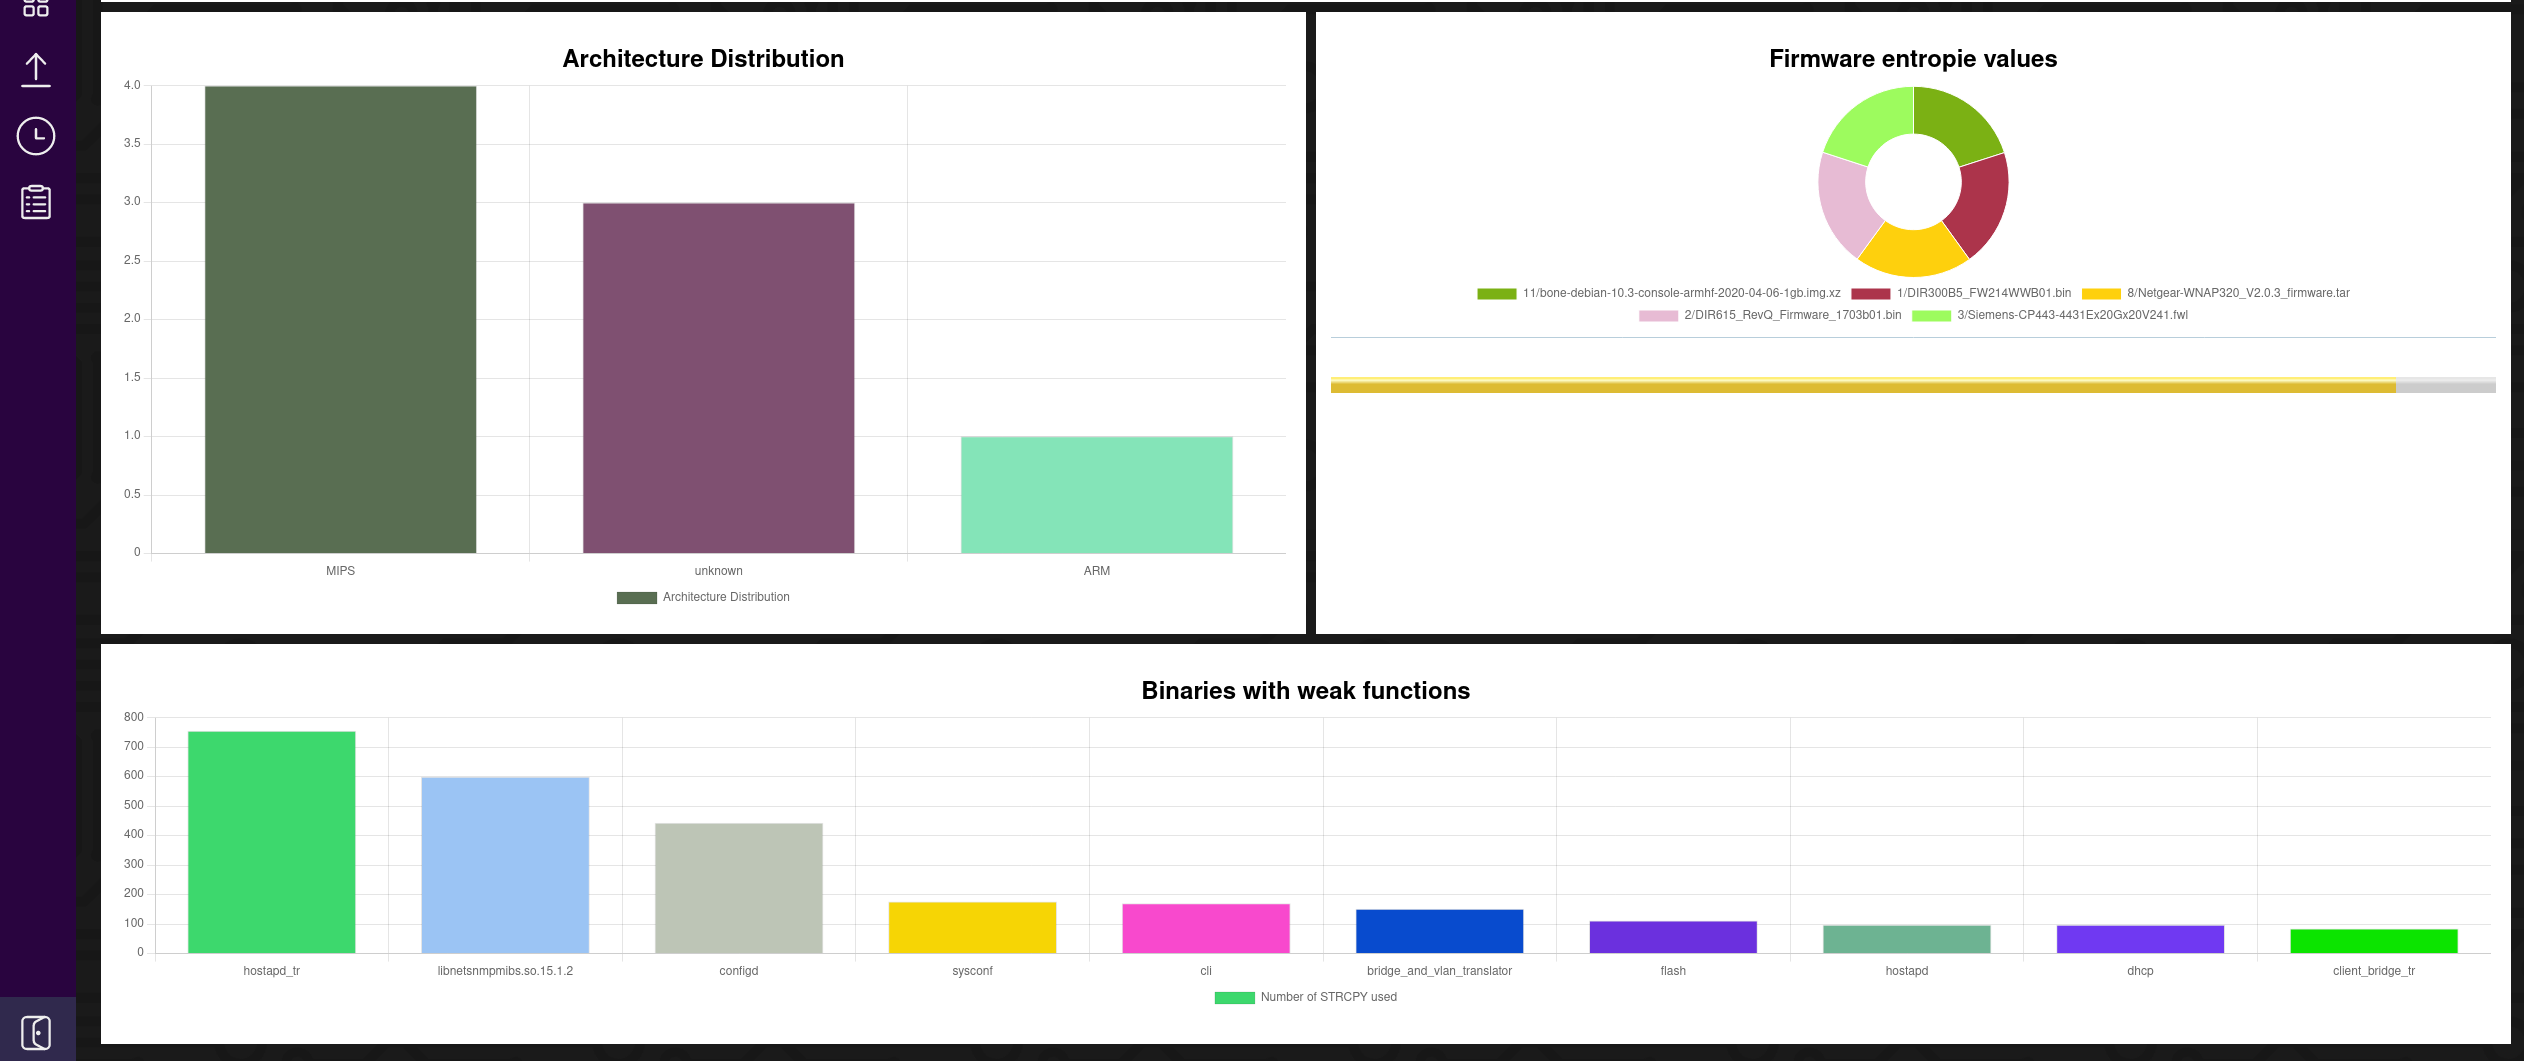
The navigation is done via the left sidebar, featuring logout at the bottom. The following sites are currently available:
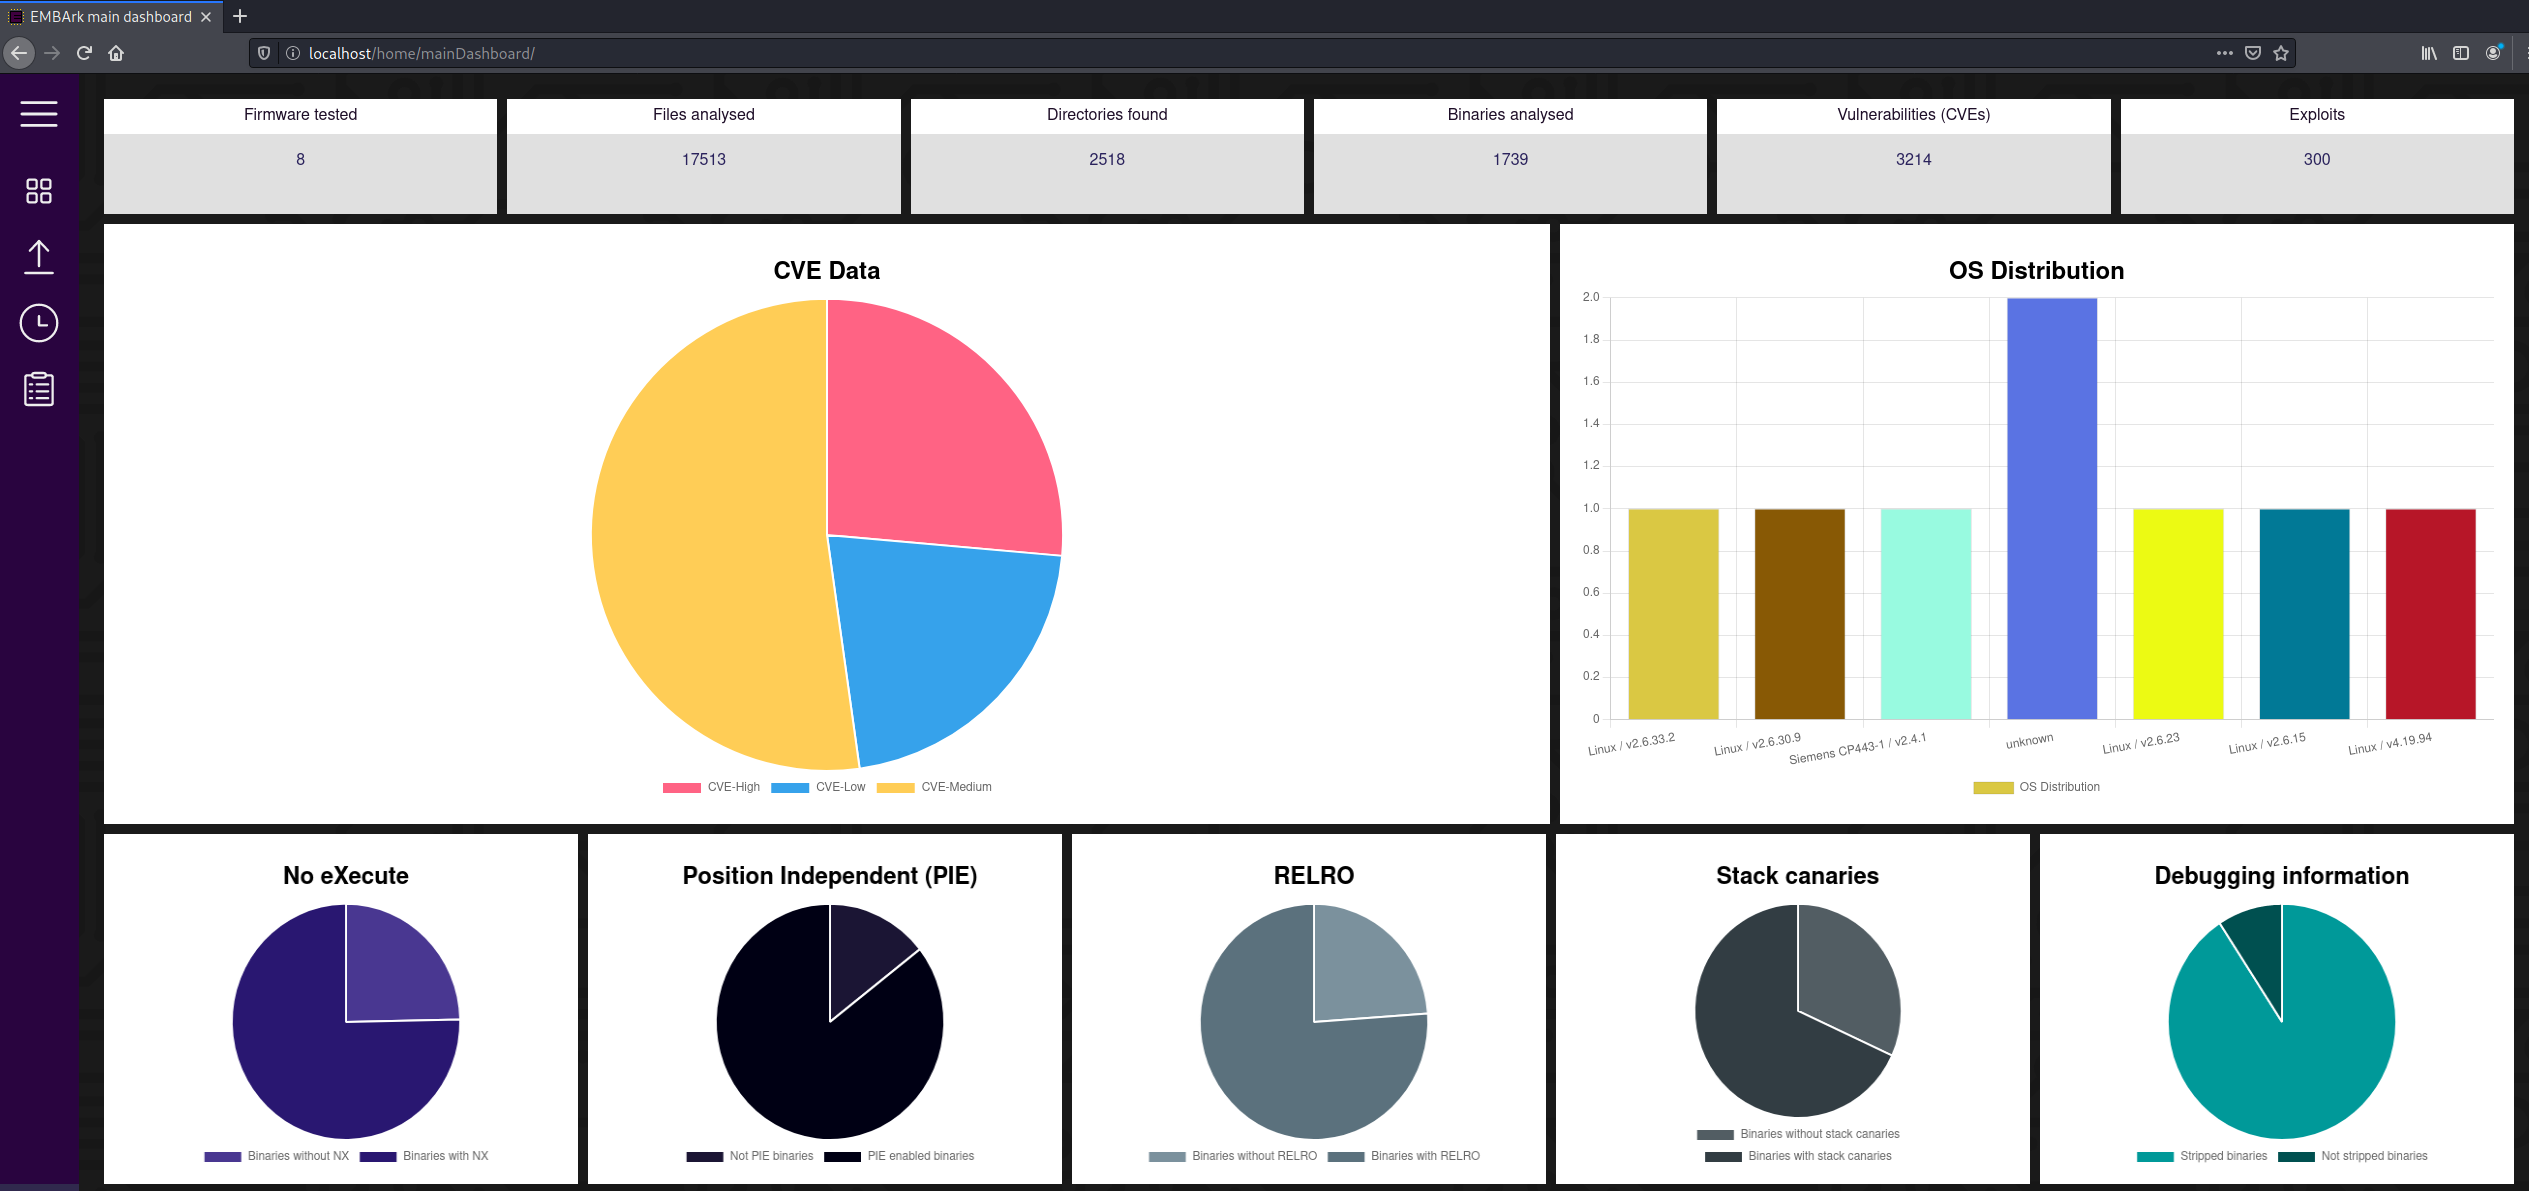
- main dashboard aggregating the collected data
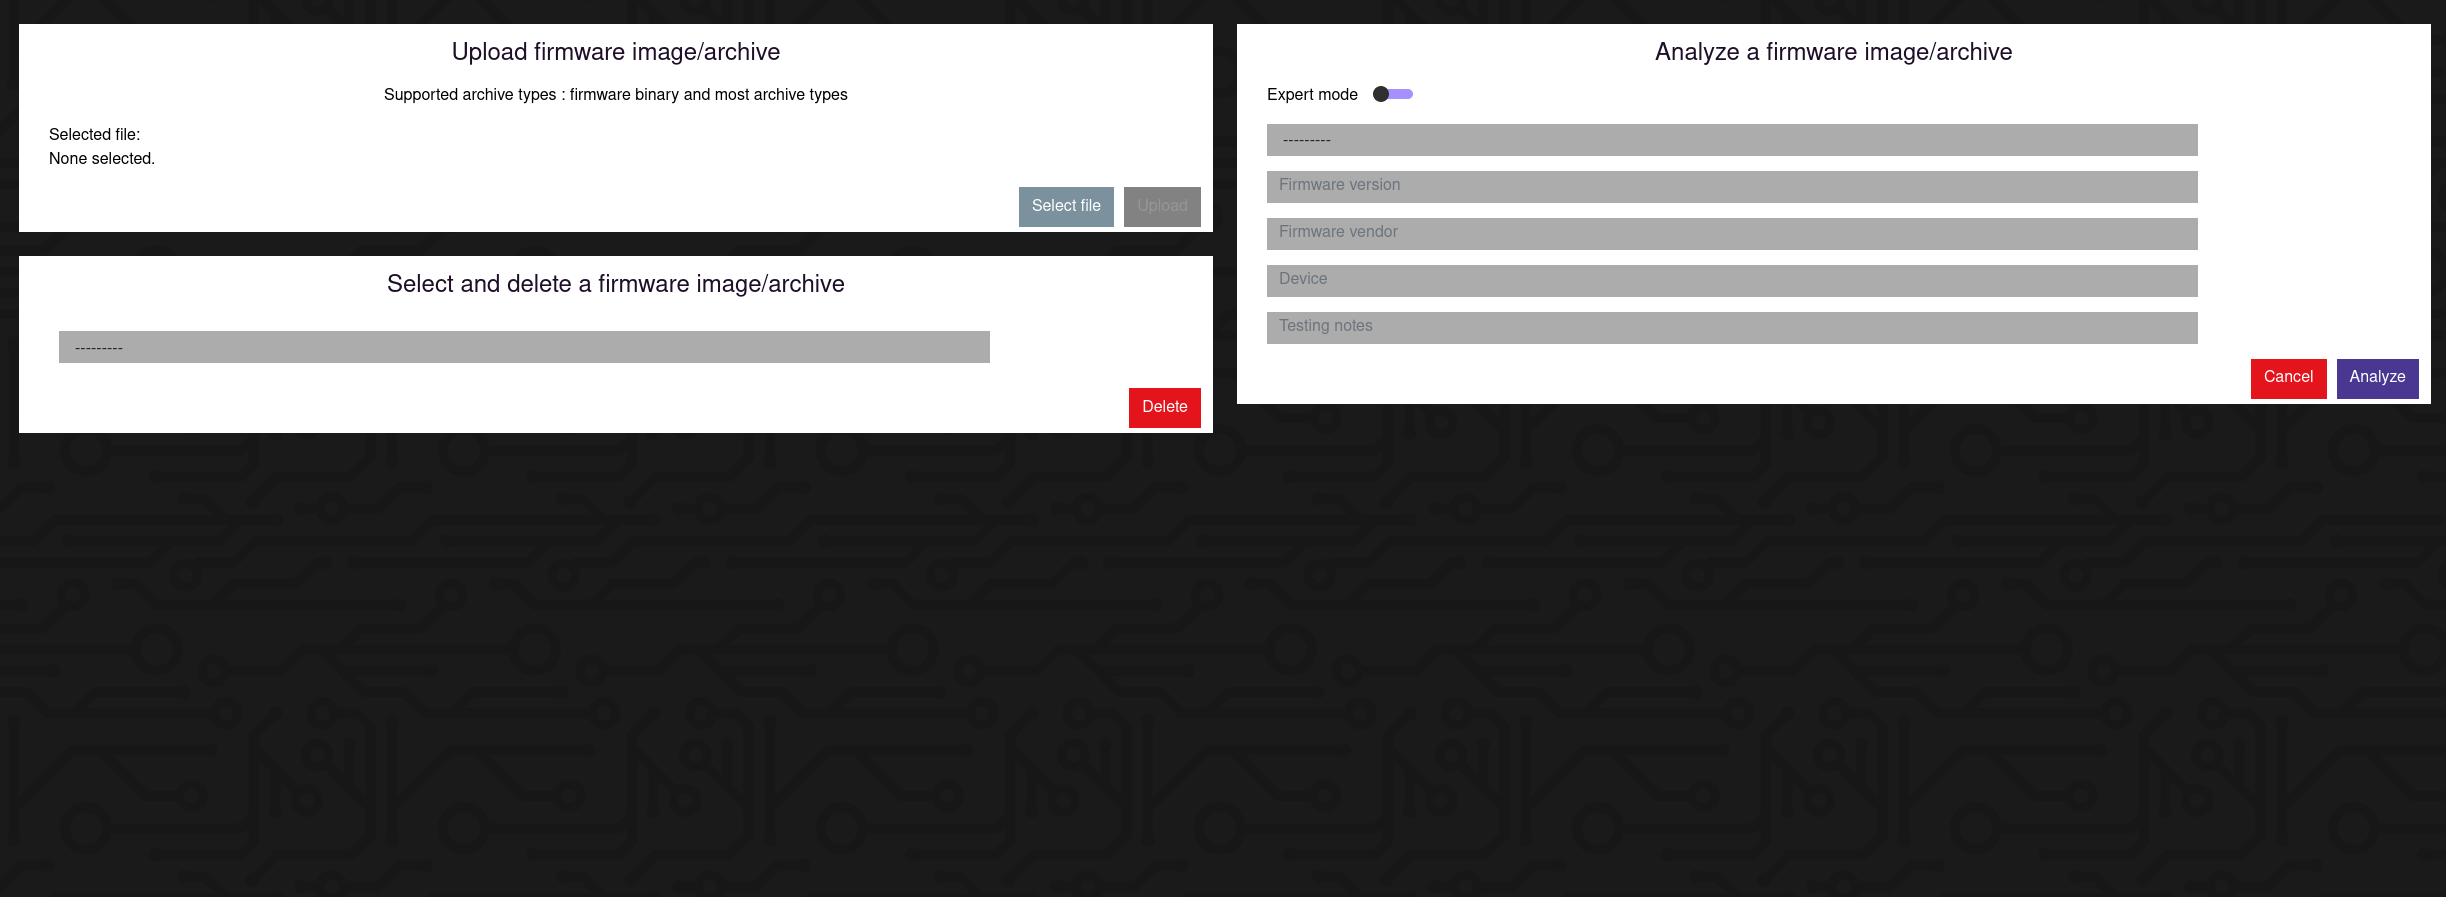
- upload/analyze page upload and start analysis process on firmware
- service dashboard current progress overview
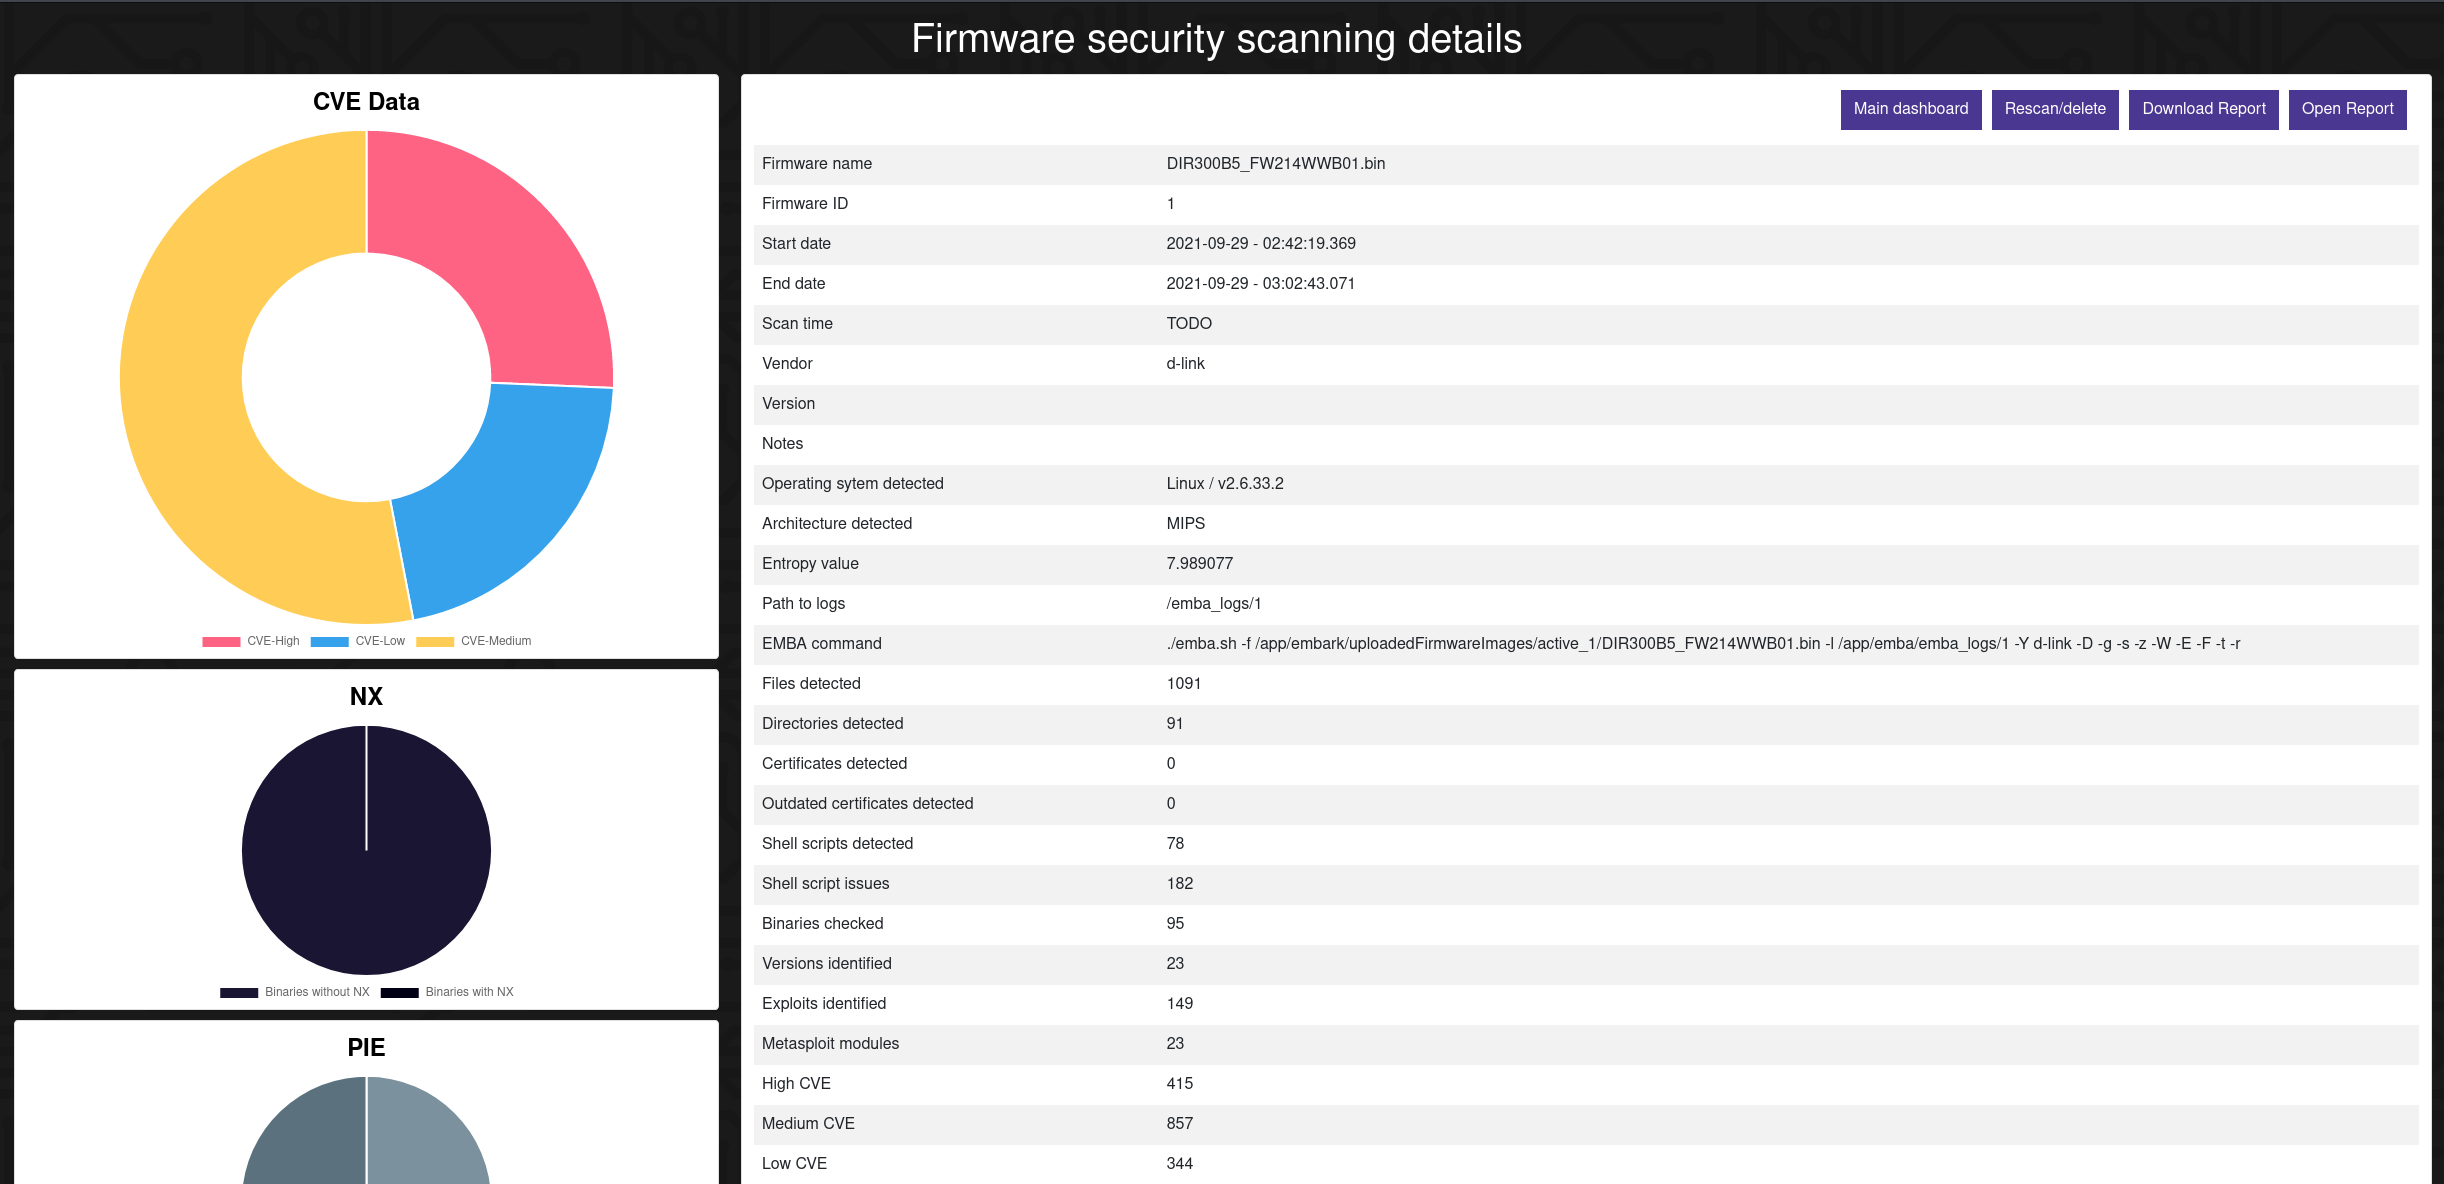
- report dashboard listing detailed information about analysed firmware
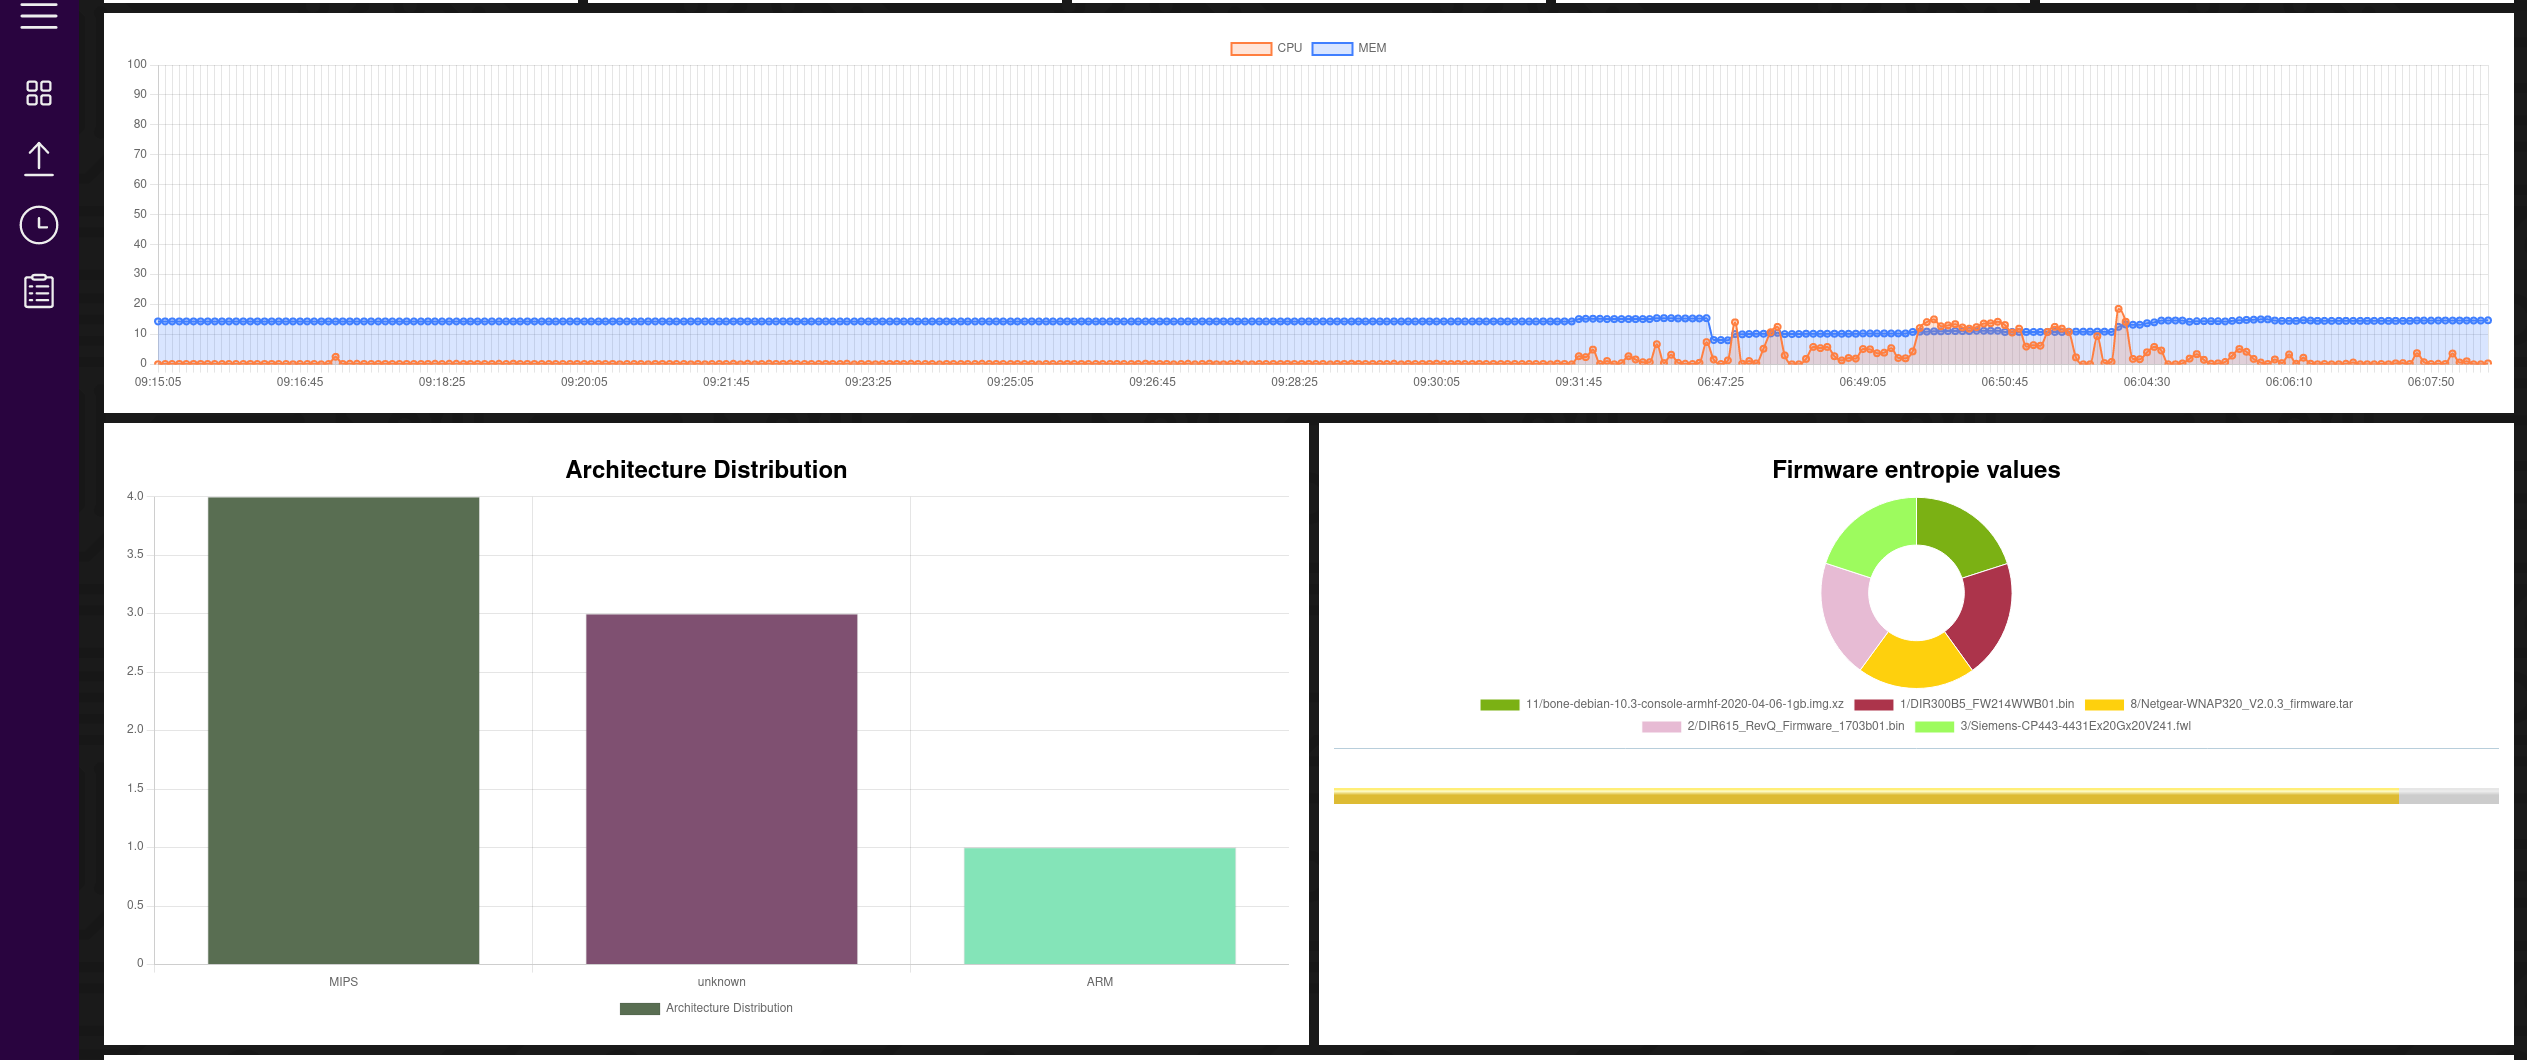
Compressed and aggregated data for overview and performance done by EMBA. This includes (but not limited to):
- Common Vulnerabilities and Exposures - CVEs
- Binary Protections - NX, Canaries, RELRO, ...
- Architecture and OS Distribution
- Top strcpy binaries
- Server Load Graph
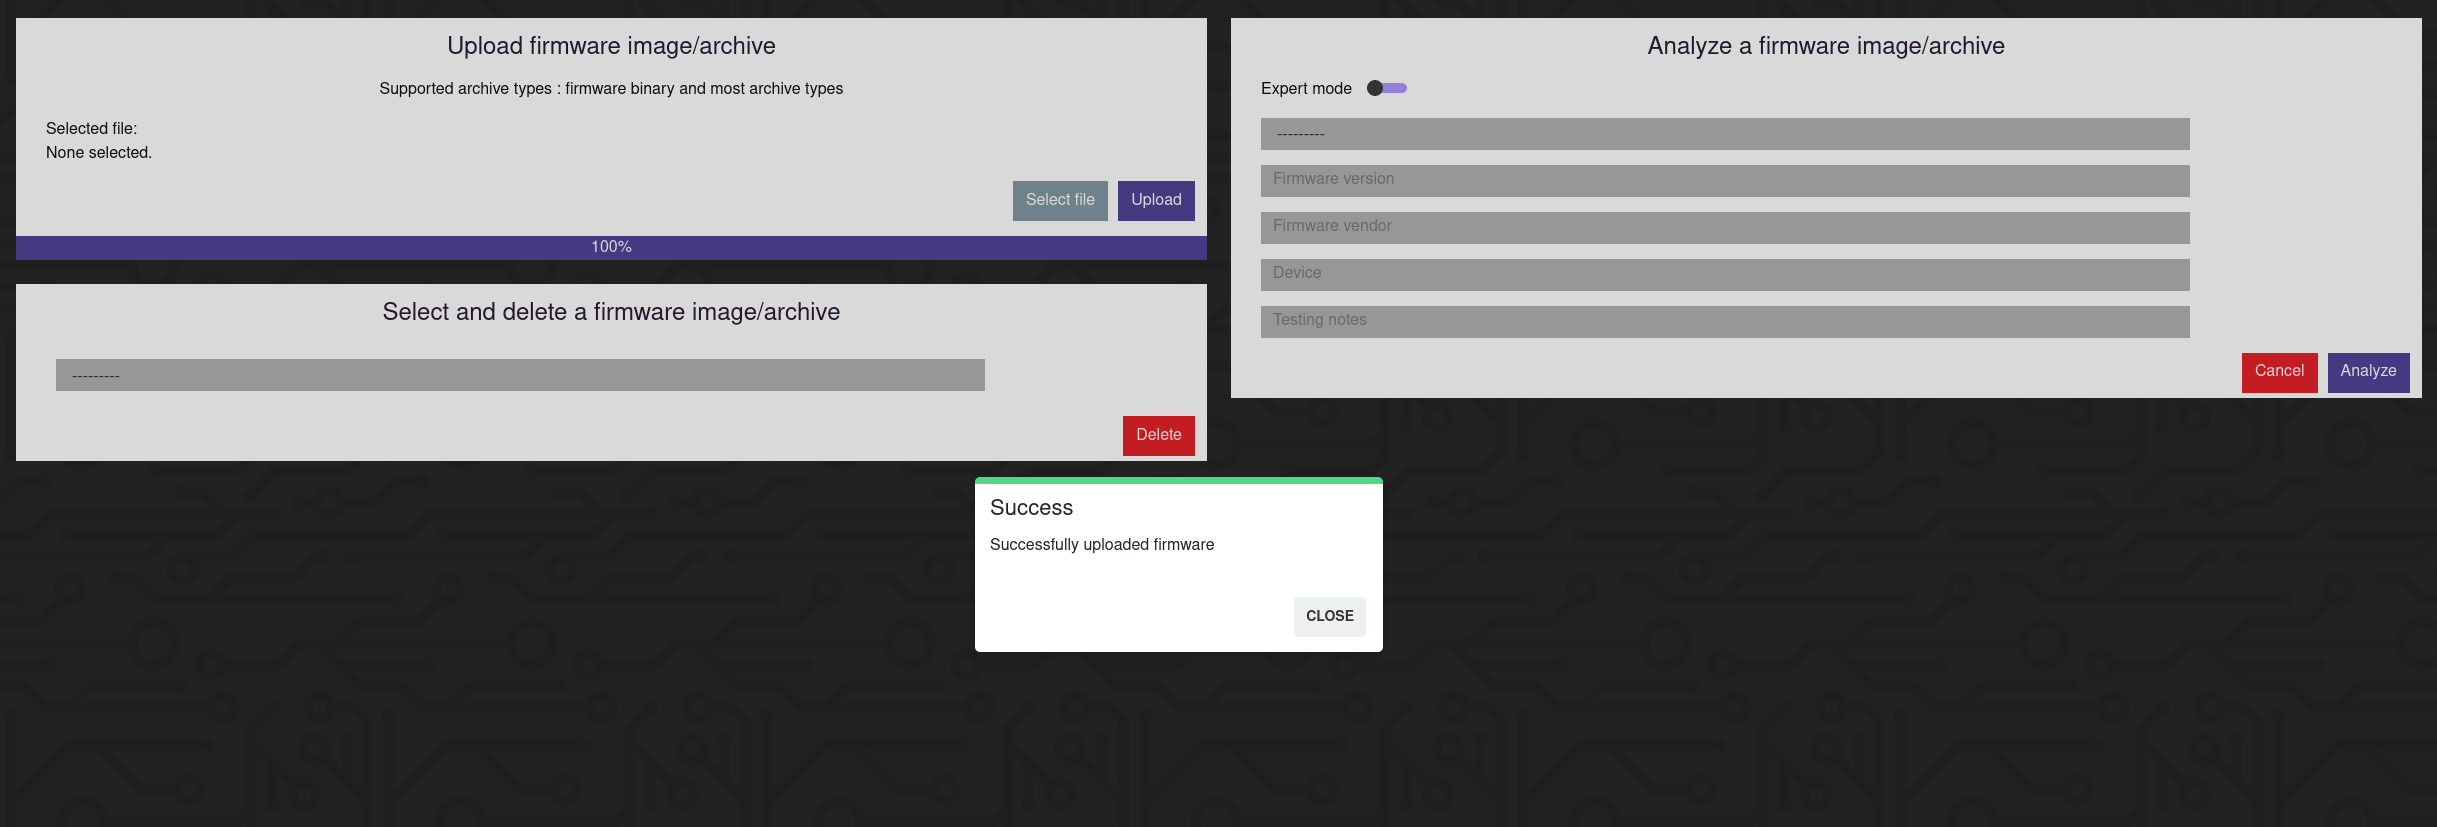
Uploading and deleting of firmware.
- Upload via drag and drop or via explicitly selecting the firmware from your local system
- Delete Firmware by selecting the firmware and accepting dialogs Starting and adapting the analysis on the right side.
- User can select from the previouse uploaded firmwares to start the detached emba analyze process
- Have a look at the expert flags, activated by slider to fit your means
The analyze step is completely detached from other User interactions.
Nevertheless users can observe the current status of each EMBA firmware scan:
- Current progress
- Executing stage
- Current module being processed

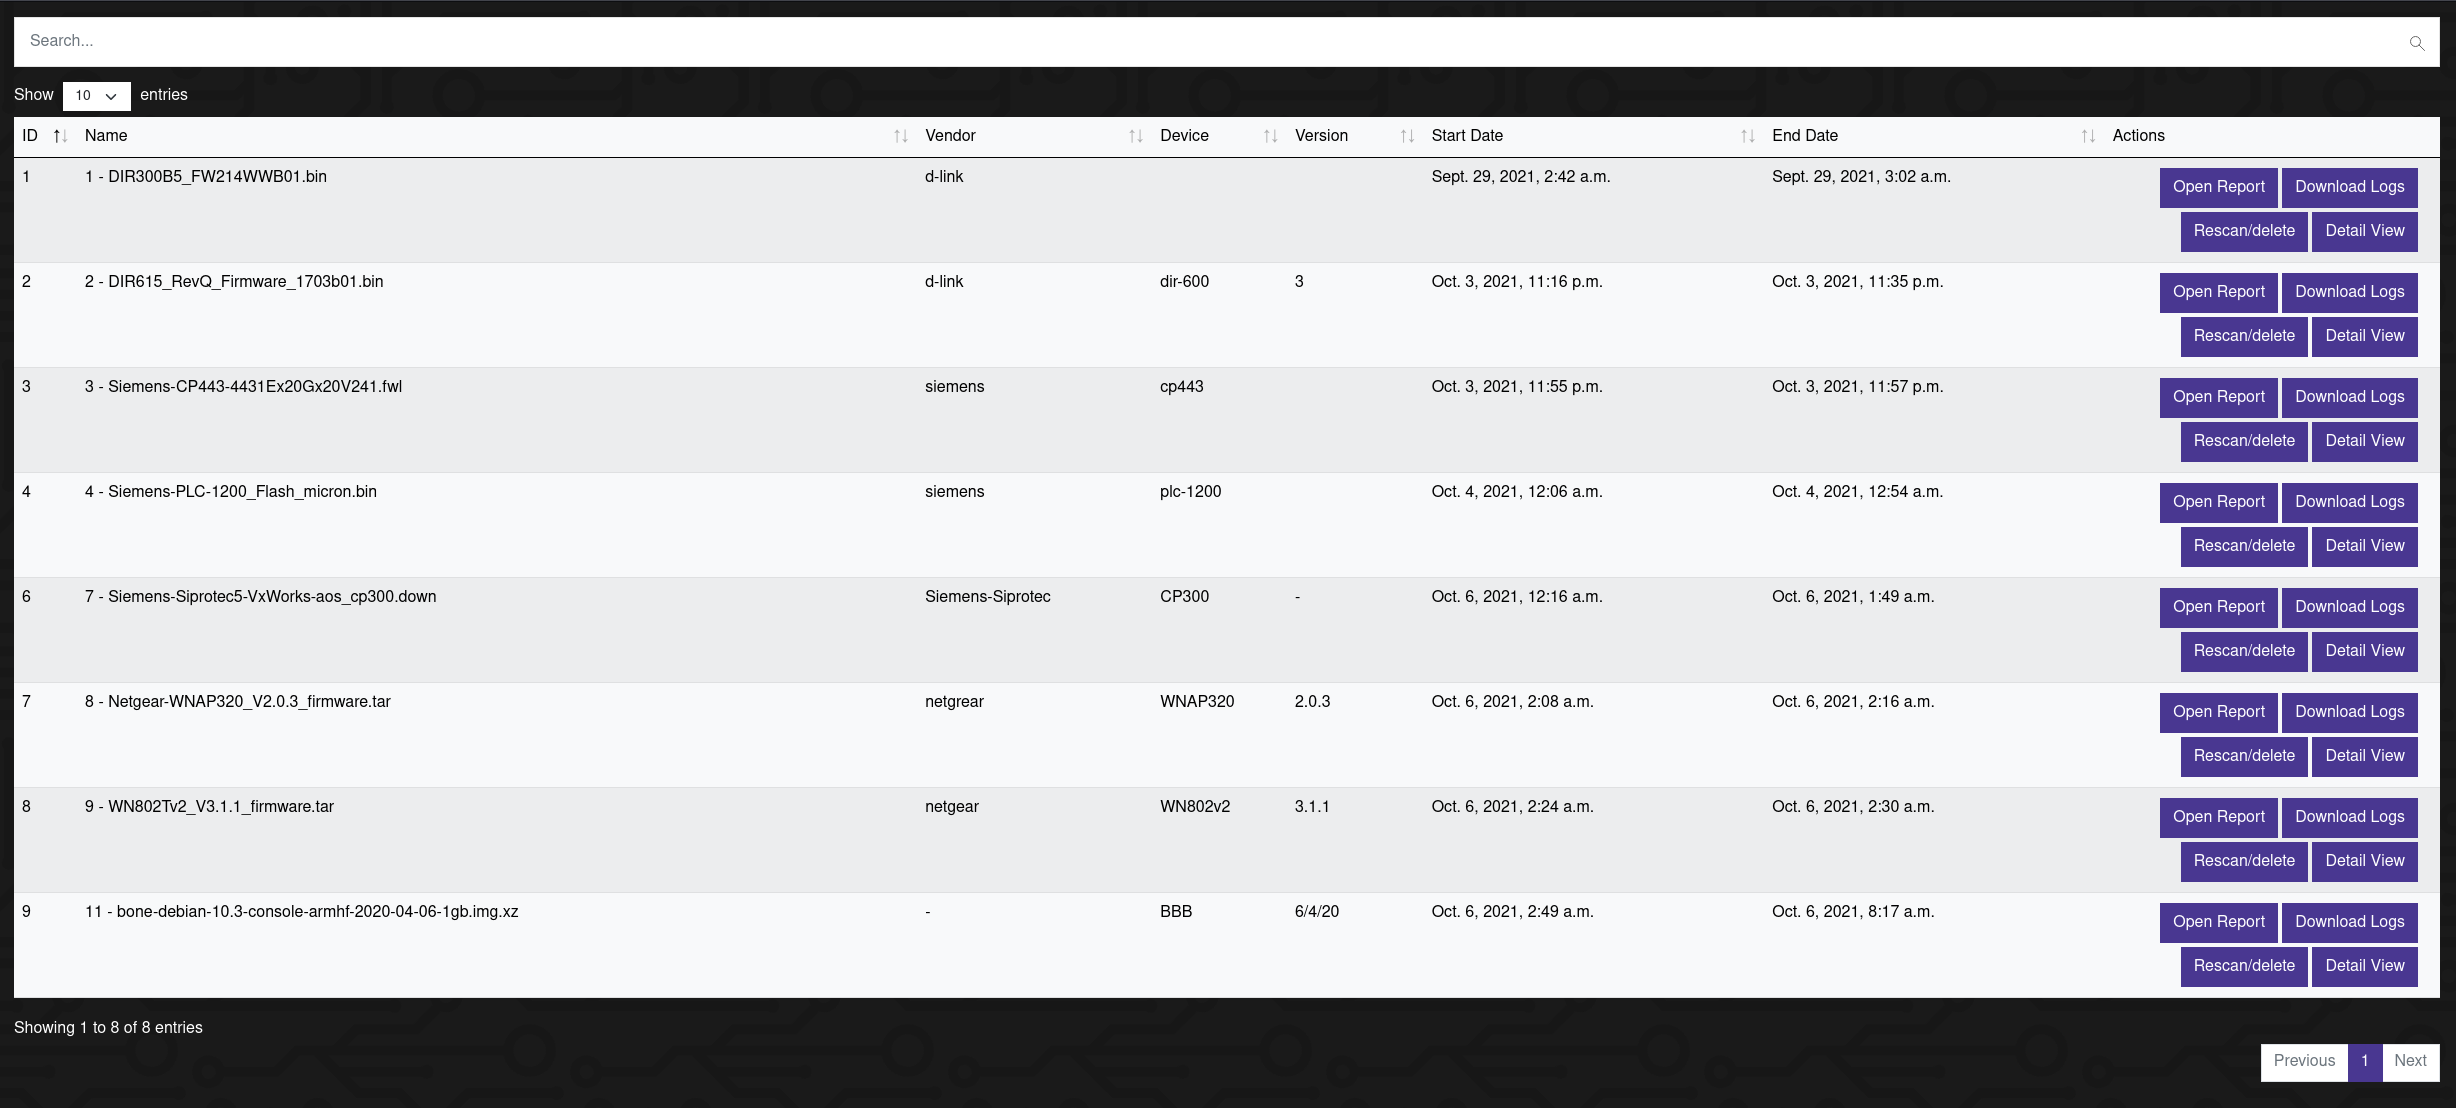
Summary of all firmwares ever analyzed by EMBA.
Search and sortable table to easily find the relevant reports.
Actions on completed firmware analysis:
- Ability to open the Individual report overview for each analysis
- Ability to open the html report generated by the firmware scanning backend EMBA
- Ability to download report generated by the firmware scanning backend EMBA
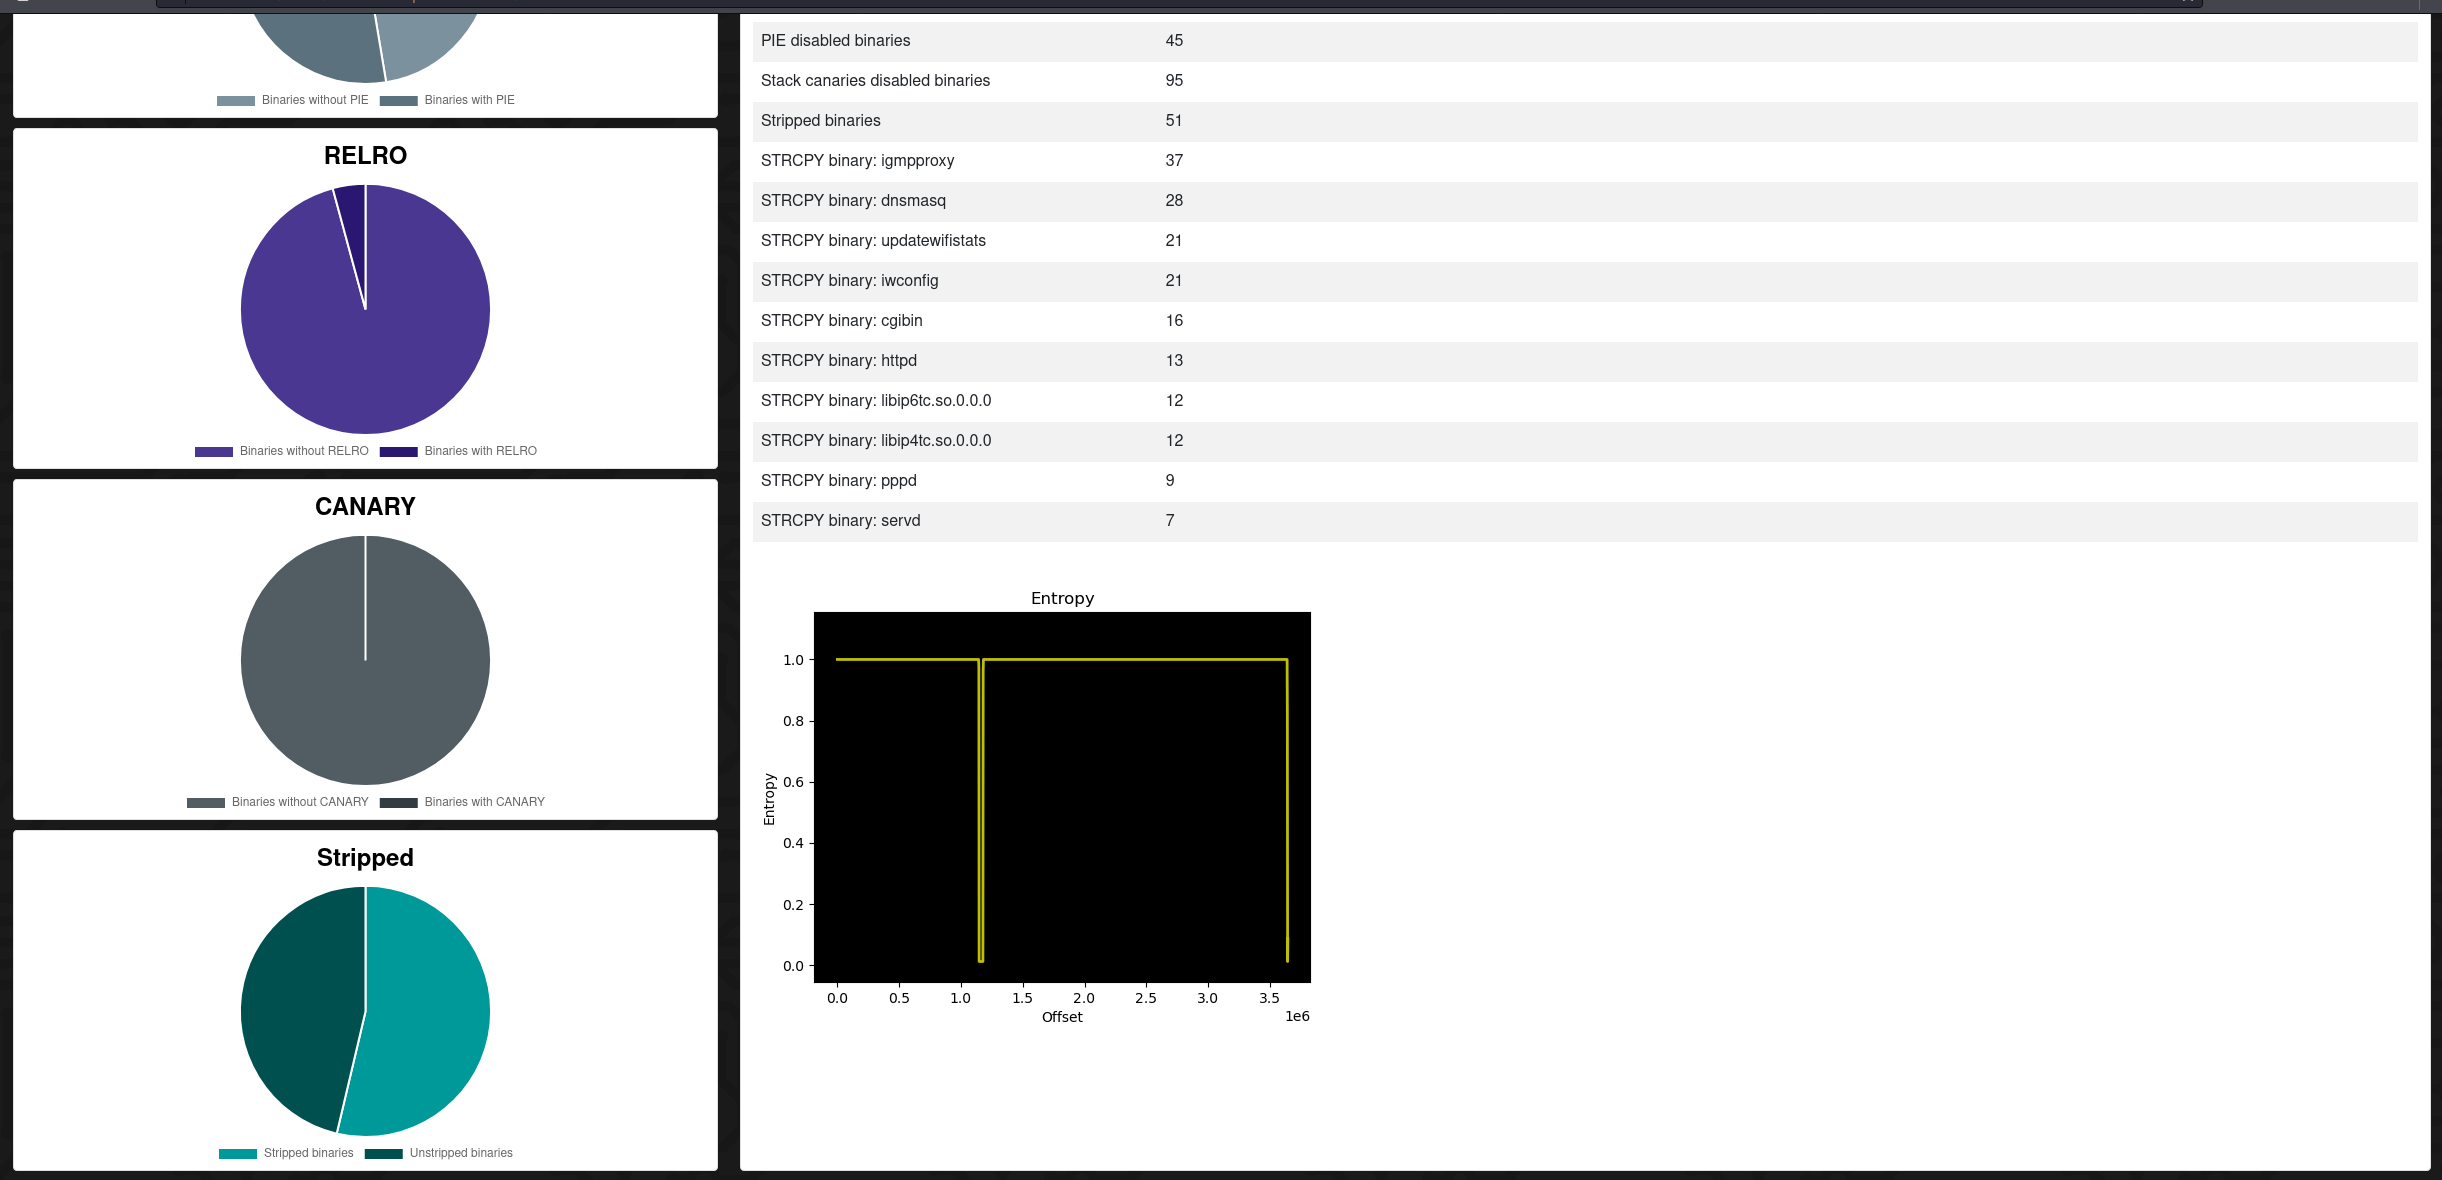
The individual Report lists relevant details about the tested firmware, as well as some charts for visualization.
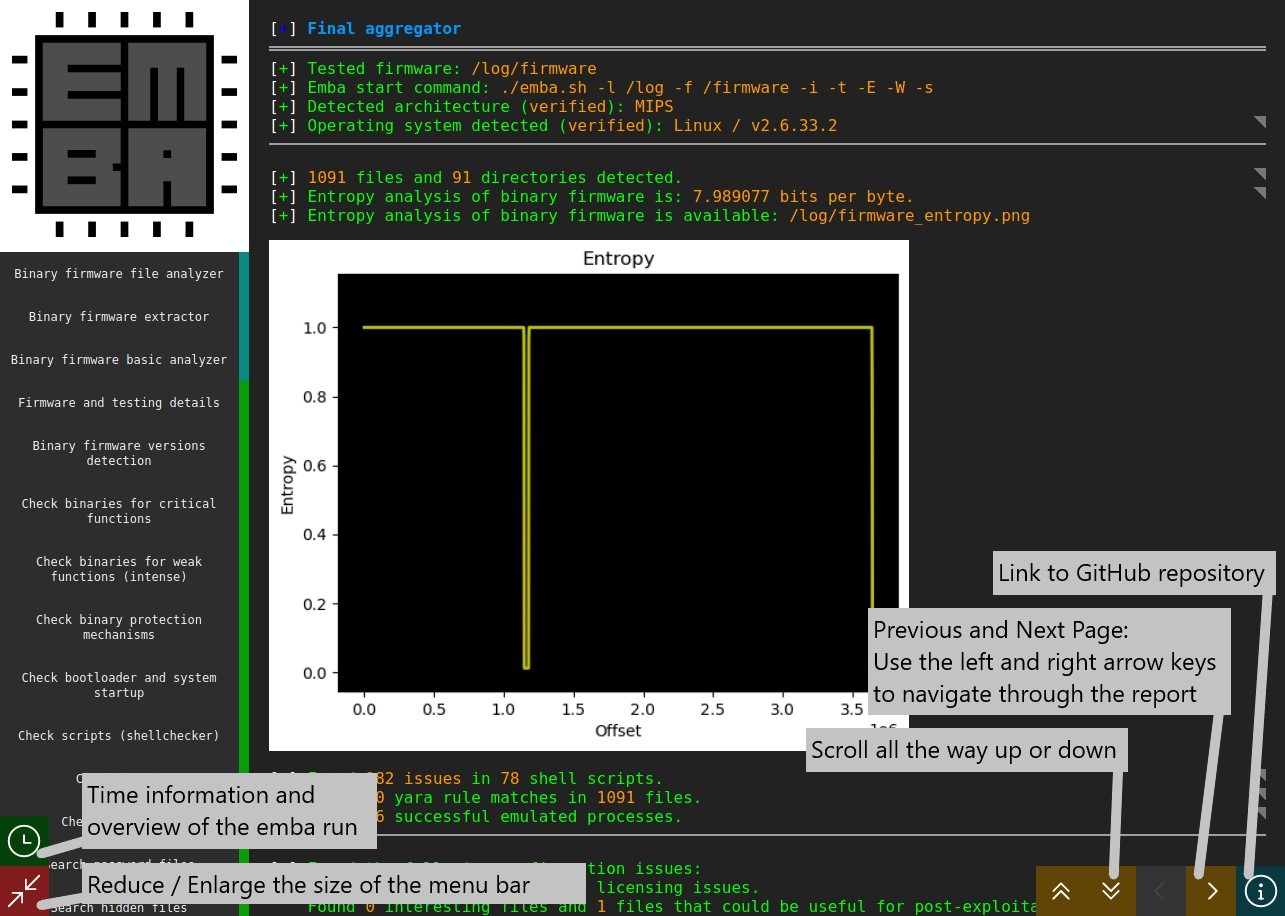
EMBA generates a html report with all testing details. This report can either be downloaded or inspected in the browser from the Report Dashboard.
! The zip may not contain a root-node/parent directory !
- Get zip:
zip -r log4fw.zip ./* - Upload to EMBArk
EMBArk - firmware security scanning at its best
Sponsor EMBA and EMBArk:
The EMBA environment is free and open source!
We put a lot of time and energy into these tools and related research to make this happen. It's now possible for you to contribute as a sponsor!
If you like EMBArk you have the chance to support future development by becoming a Sponsor
Thank You ❤️ Get a Sponsor
EMBArk - firmware security scanning at its best
