Plotcli is a command line application that can create plots from text/csv files and from piped data, making it useful during data analysis. Plotcli works best in combination with other command line tools such as awk or miller. Plotcli will ignore any lines it does not understand, so it is safe to use with files that contain non csv data as well. Typically I use it during simulations, where I simulate data, which I pipe to a file and then I plot it using plotcli:
plotcli < path/to/file
It will plot the data and save the plot to a file (by default plotcli.png). Plotcli has a command line switch similar to tail (-f) so that it will keep checking for new data until it is killed with ctrl+c.
Plotcli is meant to be adaptive and will automatically adapt the plot boundaries to encompass all the data.
Pre compiled binaries are available for linux and os x on the releases page. There are two versions, one that will save the resulting plots to disk and a second one that also supports plotting to a GTK window. When you untar the provided release file it contains a single binary (plotcli) which you should copy to your path.
The simple version just depends on cairo (libcairo2-dev in ubuntu). The gtk version also needs gtk+3 installed (libgtk-3-0 on linux, gtk+3 on OS X using homebrew).
Plotcli is written in the D programming language. The easiest way to install it is with dub, which is distributed with the dmd (the D compiler). Then you can install plotcli as follows:
git clone http://github.com/BlackEdder/plotd.git
cd plotd
dub build -b release
This will create a binary in bin/plotcli which you can copy anywhere in your path.
Compiling plotd with gtk support can be done in the following way:
dub build -c plotcli-gtk -b release
Now you can specify --format gtk and plotcli will open a window that will show the resulting plot.
Plotcli has a --help switch which explains the options available. You can also see its output here
Some of the most commonly used types of plots supported by plotcli are: point, line, hist, hist2d, density and box. Because plotcli is build on ggplotd it supports the whole range of types supported by ggplotd. An up to date list can be found in the ggplotd documentation: https://blackedder.github.io/ggplotd/ggplotd/geom.html. Any function that starts with geom is a type supported by plotcli. To get the type name you remove the geom from the function name and take the lowercase version. E.g. geomBox results in box, geomHist2D in hist2d etc.
Currently two types of legend are supported continuous or discrete (or any shorter form). Specifying these will cause a legend to be drawn on the right hand side of the plot.
This example creates lines from each column. With the x coordinate given by the row number. When run with:
plotcli < examples/1/data.txt
it produces the following figure:
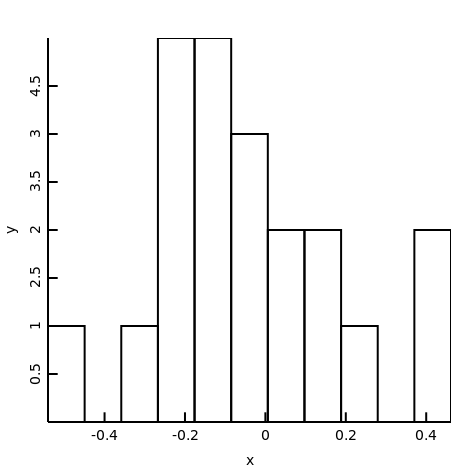
The following example creates 4 histograms, one for each column. See below for the histogram of the first column. You can see the other columns by following the links: 2, 3 and 4.
plotcli < examples/2/data.txt
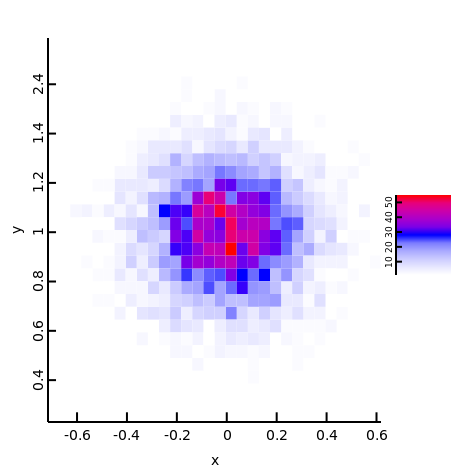
Here the first two columns are used as the x and y data for a 3D histogram.
plotcli < examples/3/data.txt
Here each column is turned into a box plot.
plotcli -o example4 < examples/4/data.txt
The package also contains a program to produce some further examples. This program is compiled with dub -c examples and builds an executable bin/generator that can be run to explore some further options.
Of course plotcli can easily be used together with other command line tools. For example I used the following command
awk '{ print $2/$3 }' abc_data/10_samples2 | plotcli -x 0 --type hist
To plot a histogram of the second column divided by the third column.
Note that for long running pipes they tend to buffer and only when full start forwarding the output to plotcli. In these cases it makes sense to use a program like unbuffer to force forwarding the results as they arrive. See bin/generator long for a good example.
The library is distributed under the GPL-v3 license. See the file COPYING for more details.


